Apache Superset - powerful and free way to visualize your data
The benefits of data visualization are hard to underestimate. Whether it’s a small MVP or an already built business, everyone will find value in eye-catching charts instead of thousands of monotonous lines of text. And it is especially good when you do not need to develop anything yourself to get these charts.
In this article I will talk about Apache Superset - this is a business intelligence (BI) application. It was developed at Airbnb and later posted on open source. You can easily connect it to your databases and visualize, perhaps, any kind of data or metrics that you can imagine.
I will briefly describe the system itself and its strengths. After that, I will describe the process of installation and give some examples on working with data.
The BI solutions market has been around for many years and there are many players in it. Present as enterprise solutions - Tableu, Power BI from Microsoft, Zoho Analytics; as well as small platforms. Therefore, first of all, I will describe several reasons why you should pay attention to Apache Superset.
Open source
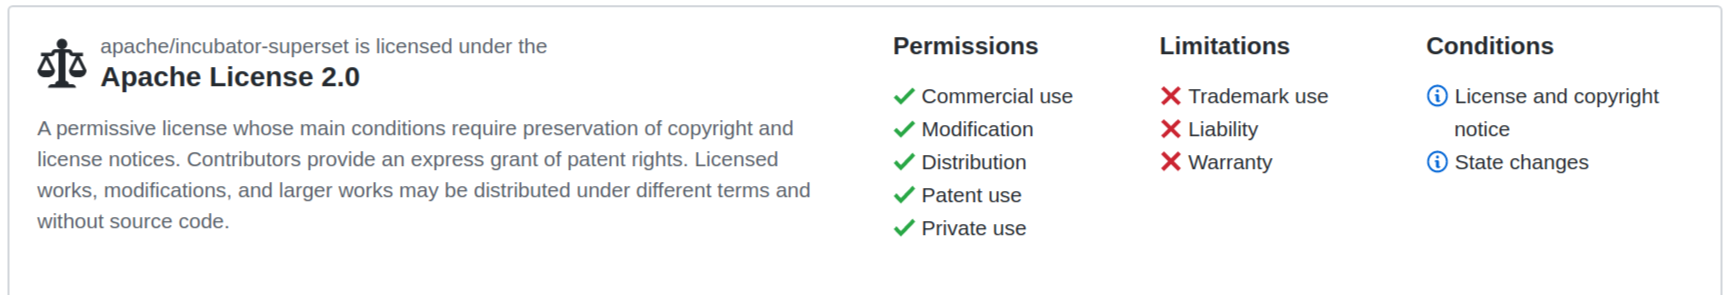
That's right, this BI system comes with open source (Github). Firstly, this means that you can use the software for free. Secondly, you are not dependent on developers and suppliers (I will talk about them separately). Moreover, the code is under the Apache 2.0 license, which does not impose significant legal restrictions on you.
Dozens of types of visualizations
Superset is in no way inferior to renowned BI solutions among the possible visualizations. There are a great many of them - from simple line and pie chart to nested treemap and horizon graph.
Project developers
Initially, the project was created inside the Airbnb company. In 2017, the project was released in open source, where after a while it was transferred to the Apache Foundation incubator, known for such projects as Apache HTTP server, Kafka, CouchDB, Spark, Cordova and many others.
The fact that Superset was able to win competition for a place in the Apache incubator indicates the maturity of the project, compared to its open source competitors.
Over 30 supported data sources
A full list of available integrations is described on the project website, I will list only the most common ones:
- PostgreSQL
- MySQL
- Elasticsearch
- Clickhouse
- MySQL
- Sqlite
In case you do not have a database, Superset supports working with regular CSV tables.
Role model
Superset can manage an arbitrary number of users with individual set of permissions. You can find more information on the roles in the documentation, I will only give a complete list of possible permissions:
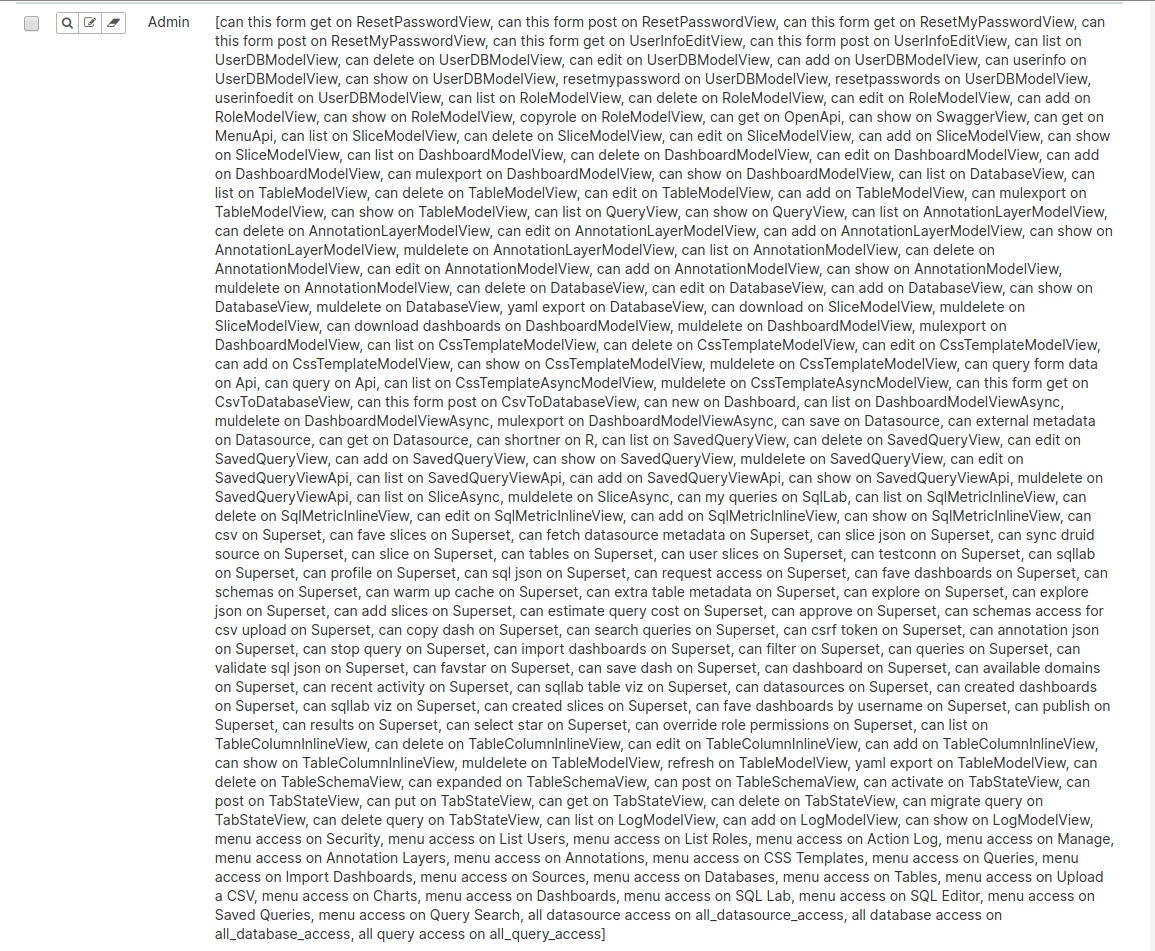
Without going into the meaning of the terms above, it is clear that the separation of roles is much more serious than just read / edit.
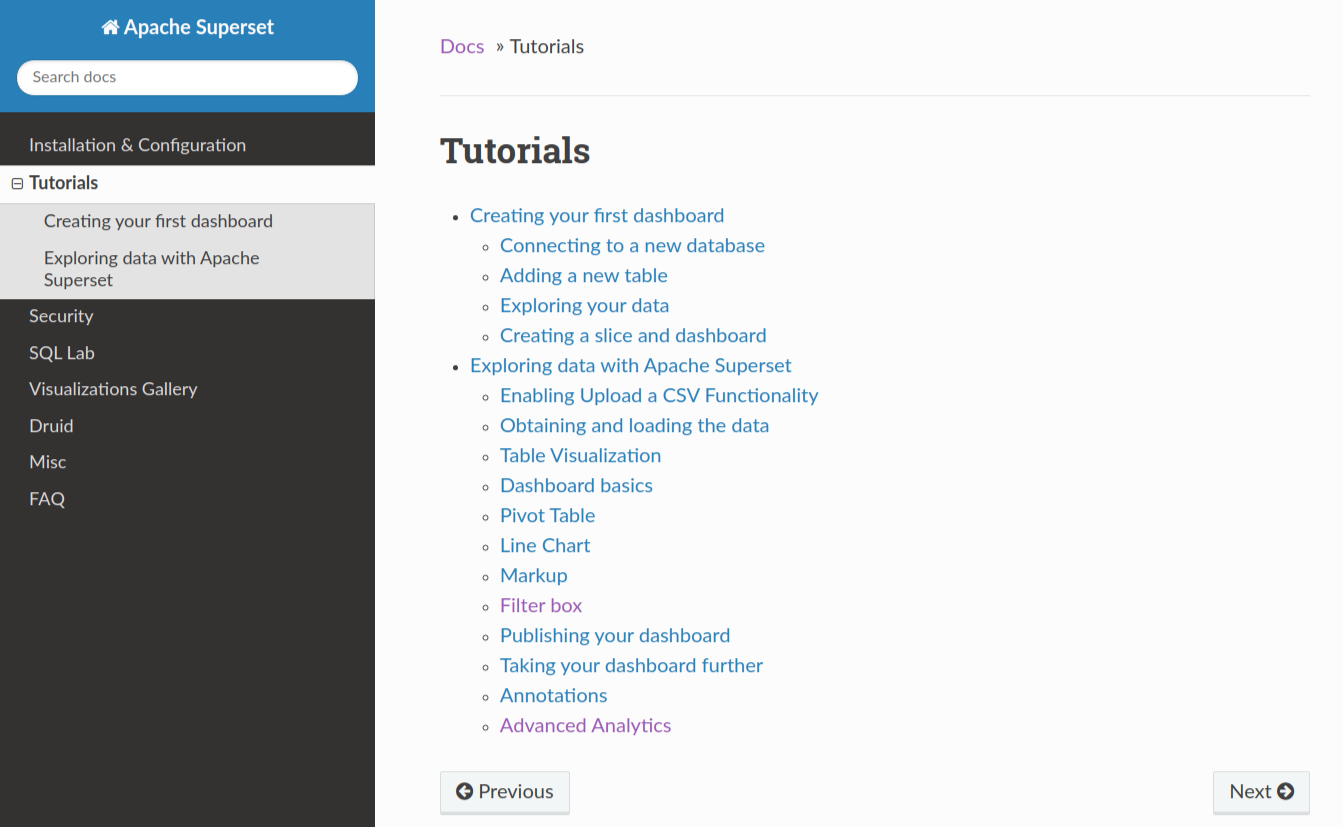
Quality documentation
In this article, I have already referenced the documentation several times and this is justified. It describes in detail a variety of topics: installation, configuration, examples of creating graphs and reports, role model, FAQ, working with SQL Lab and much more.
Data privacy
This feature follows from the open source nature of the project, but it deserves a separate point. Since you are deploying Superset on your own server, the data will not leave your perimeter. Unlike for example Power BI, which is deployed somewhere in Microsoft's cloud.
Installation and launch
git clone https://github.com/apache/incubator-superset/
cd incubator-superset
docker-compose up -dDashboards
In a few words - Superset dashboards are beautiful! They are easy to create, you can template them, it’s convenient to compose graphics, text, pictures and everything else.
As an example, let me show you the default dashboards. When installing, you get several data samples:
- World population
- US Name Statistics
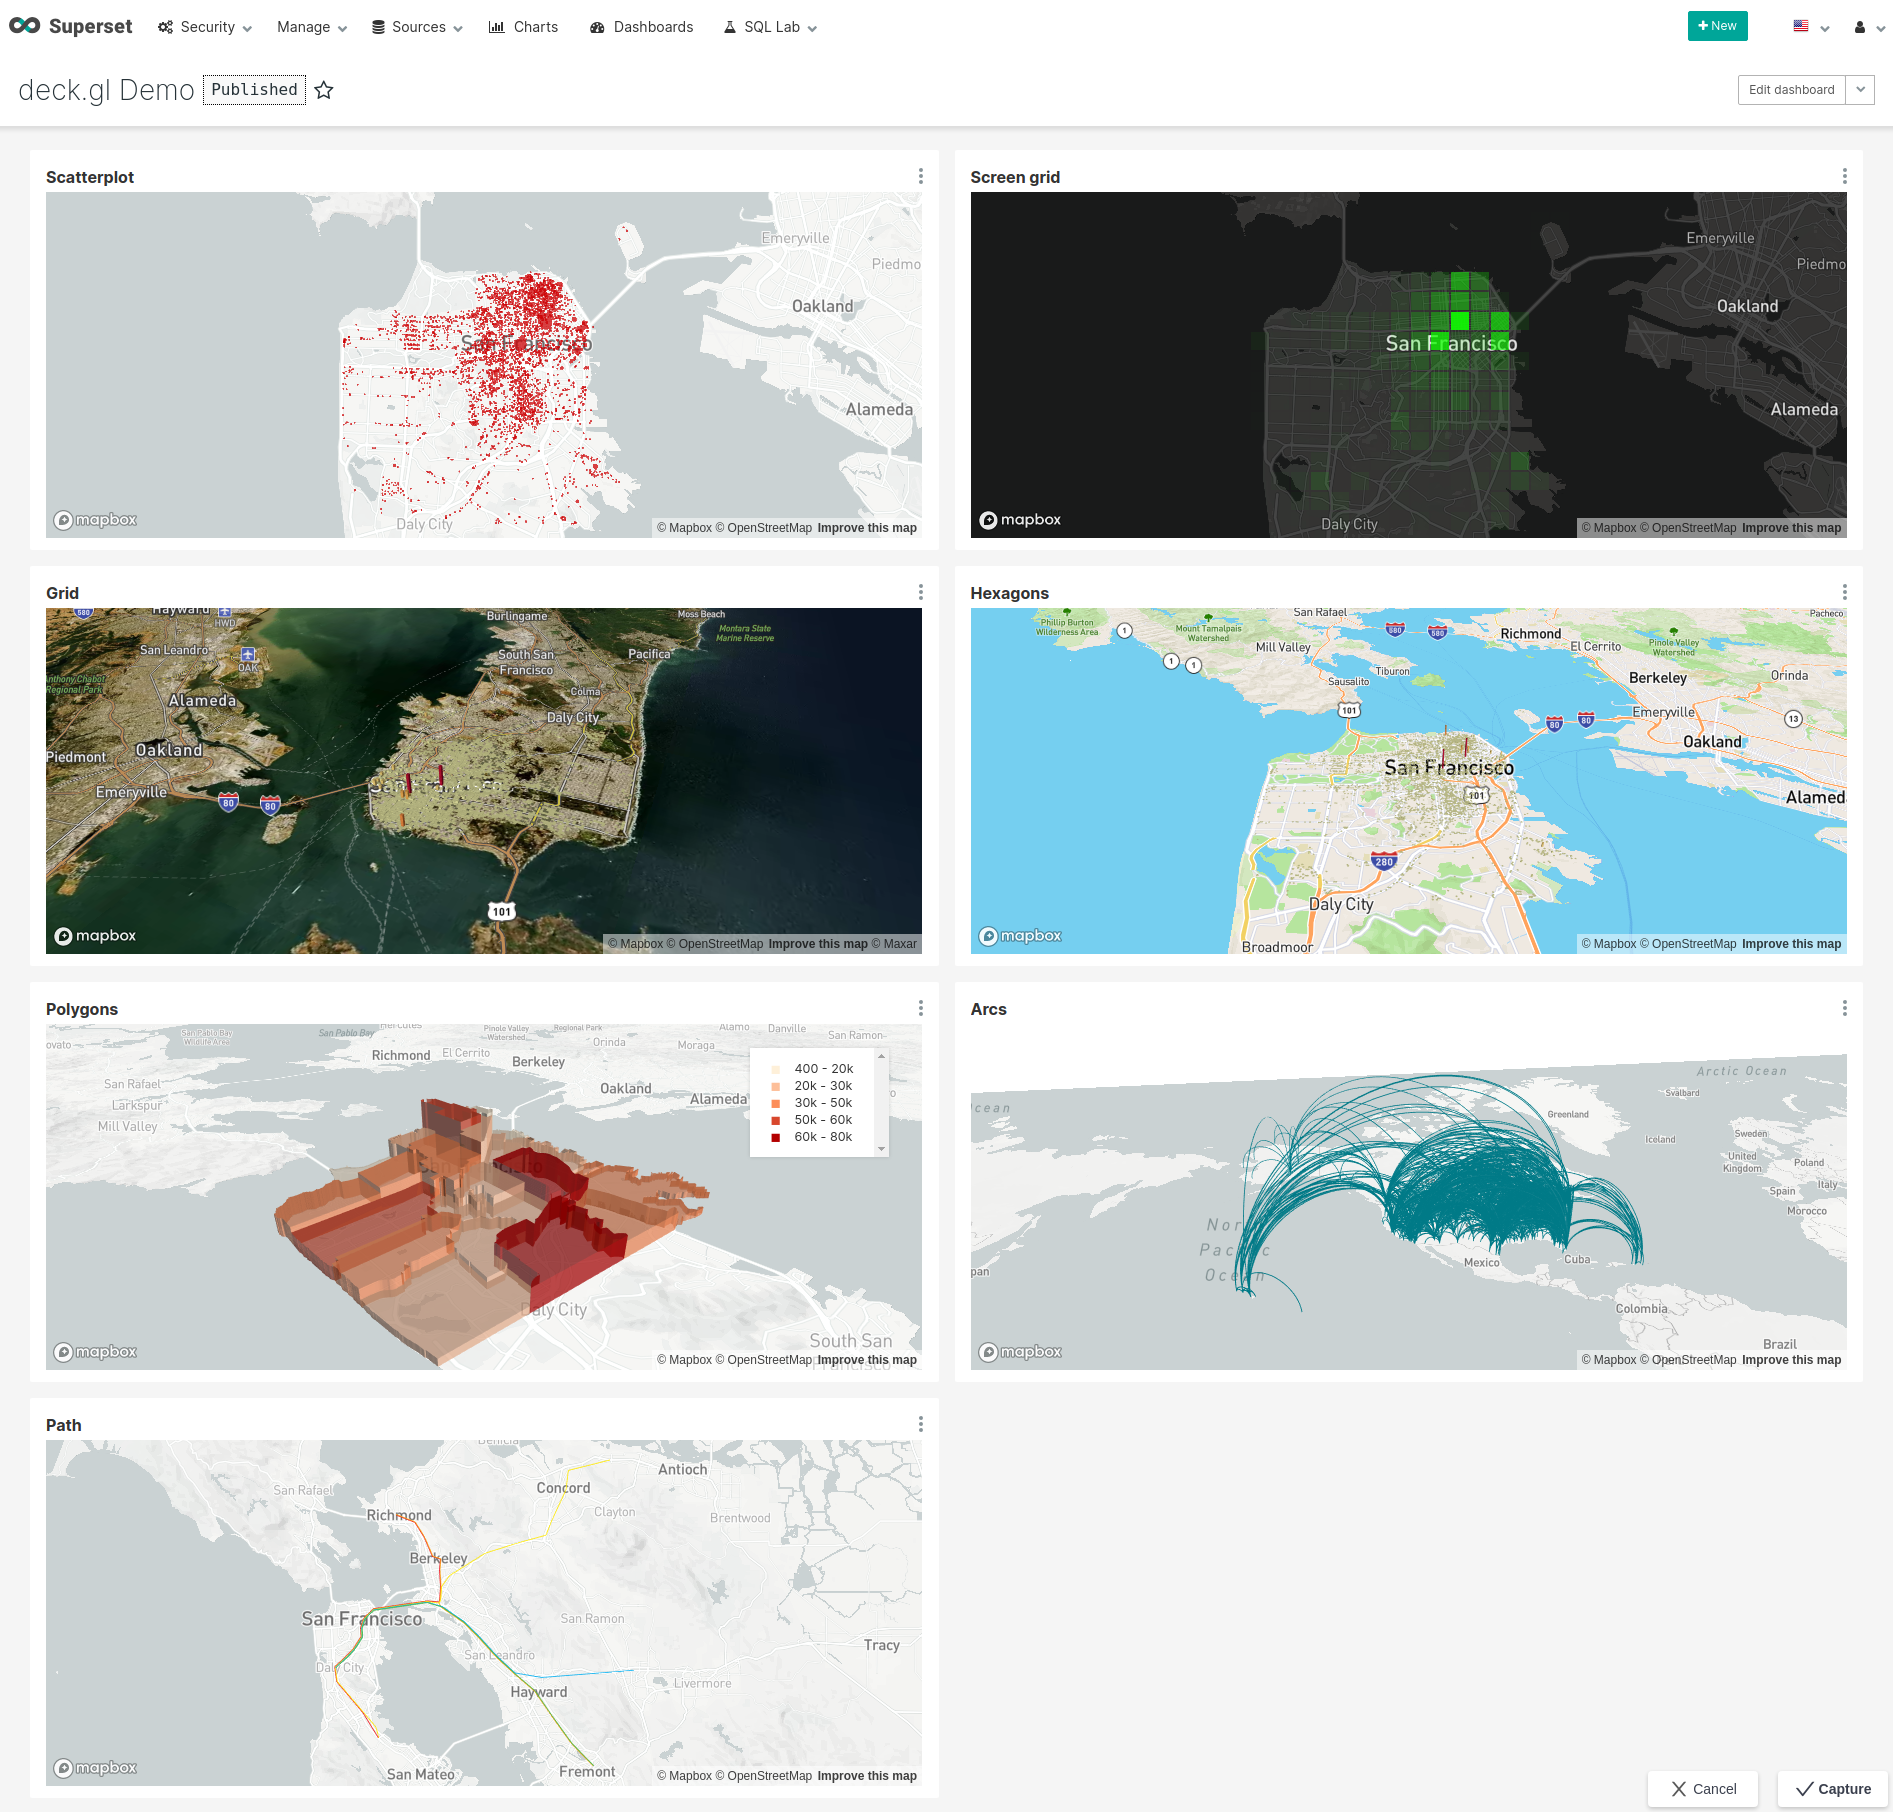
- Some geo data
For each data sample, pre-defined dashboard is available.
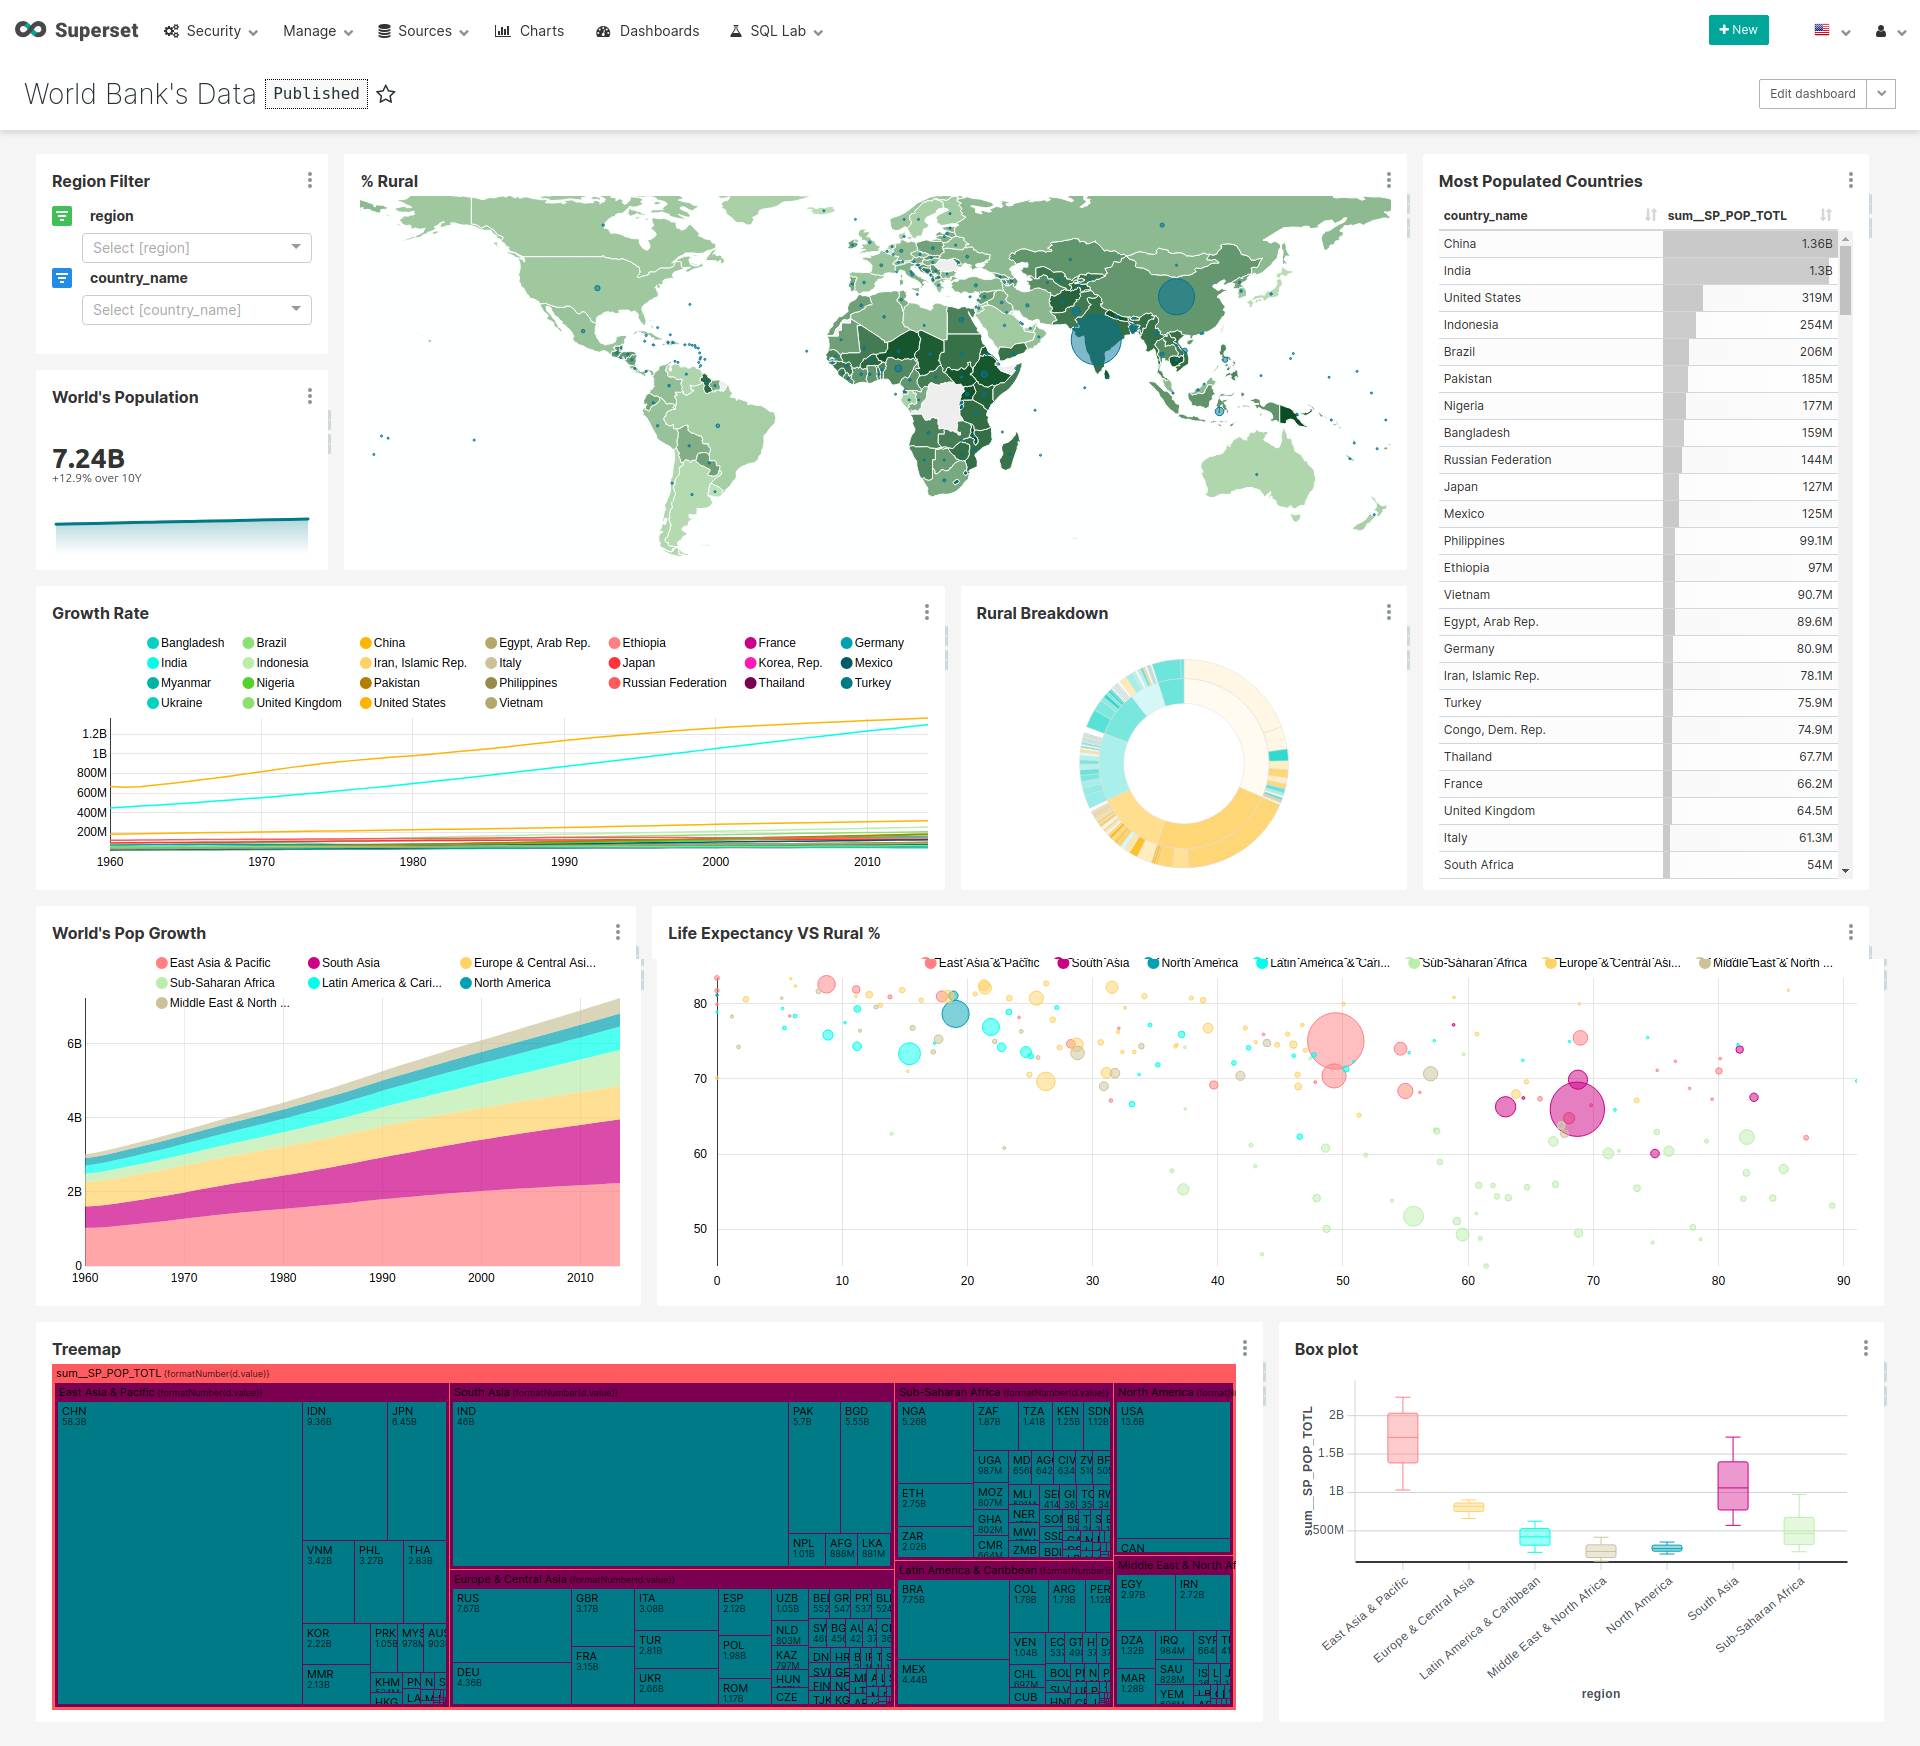
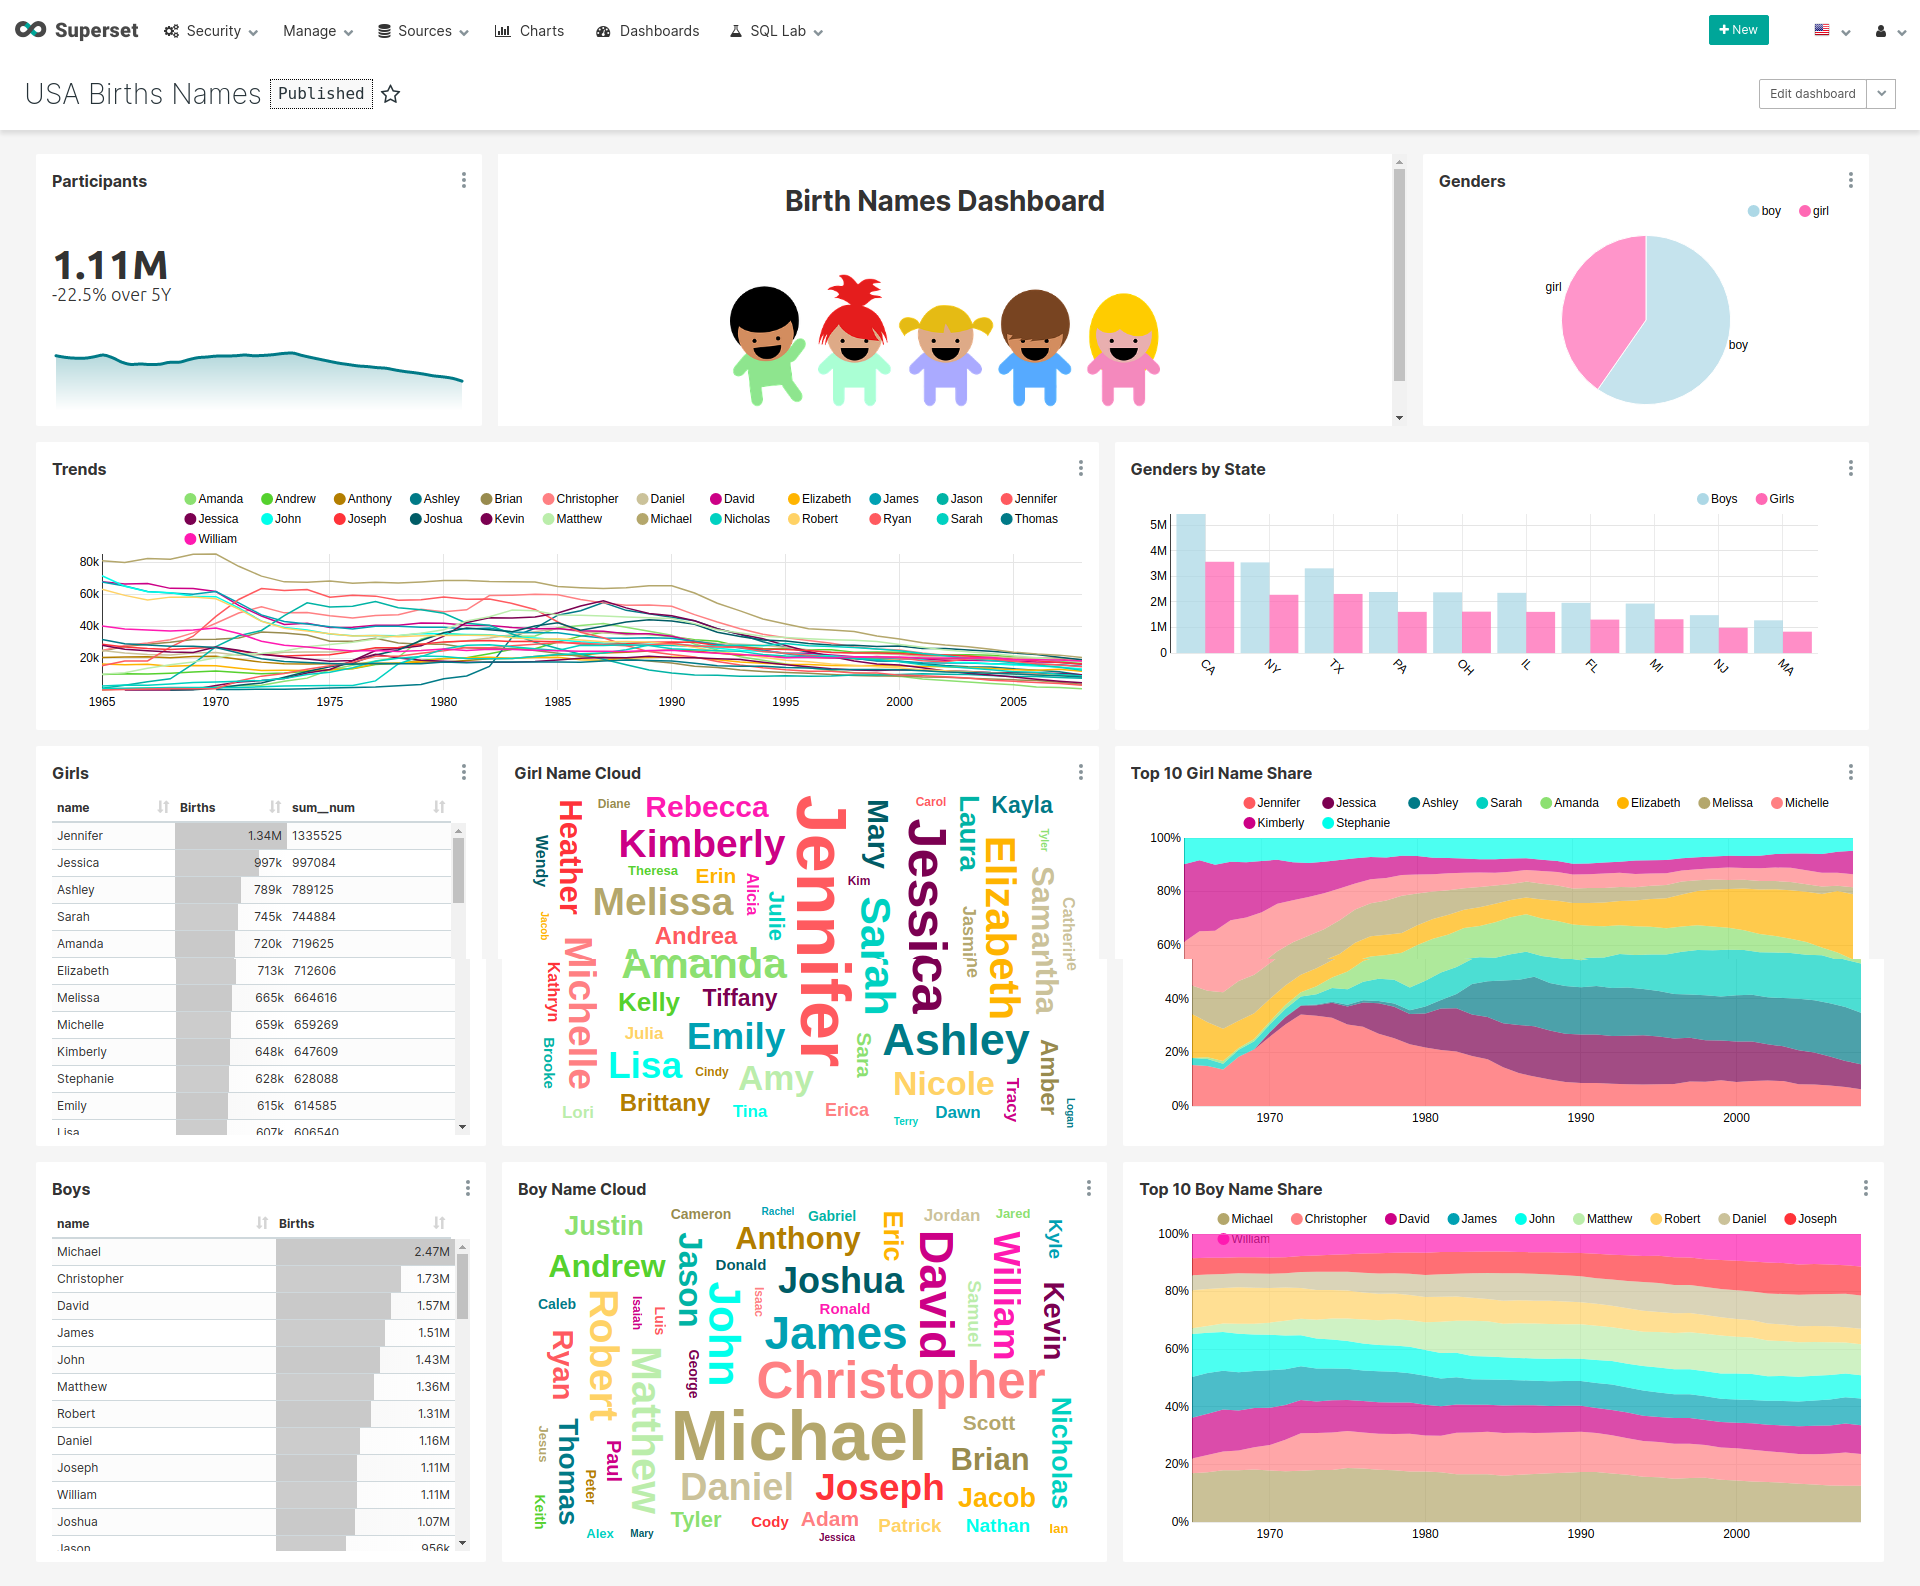
You can see that Superset can do a lot. There is a convenient grid, aggregations, nesting levels, filters for managing charts, the ability to integrate specific actions on a selection or click into charts.
Visualization Examples
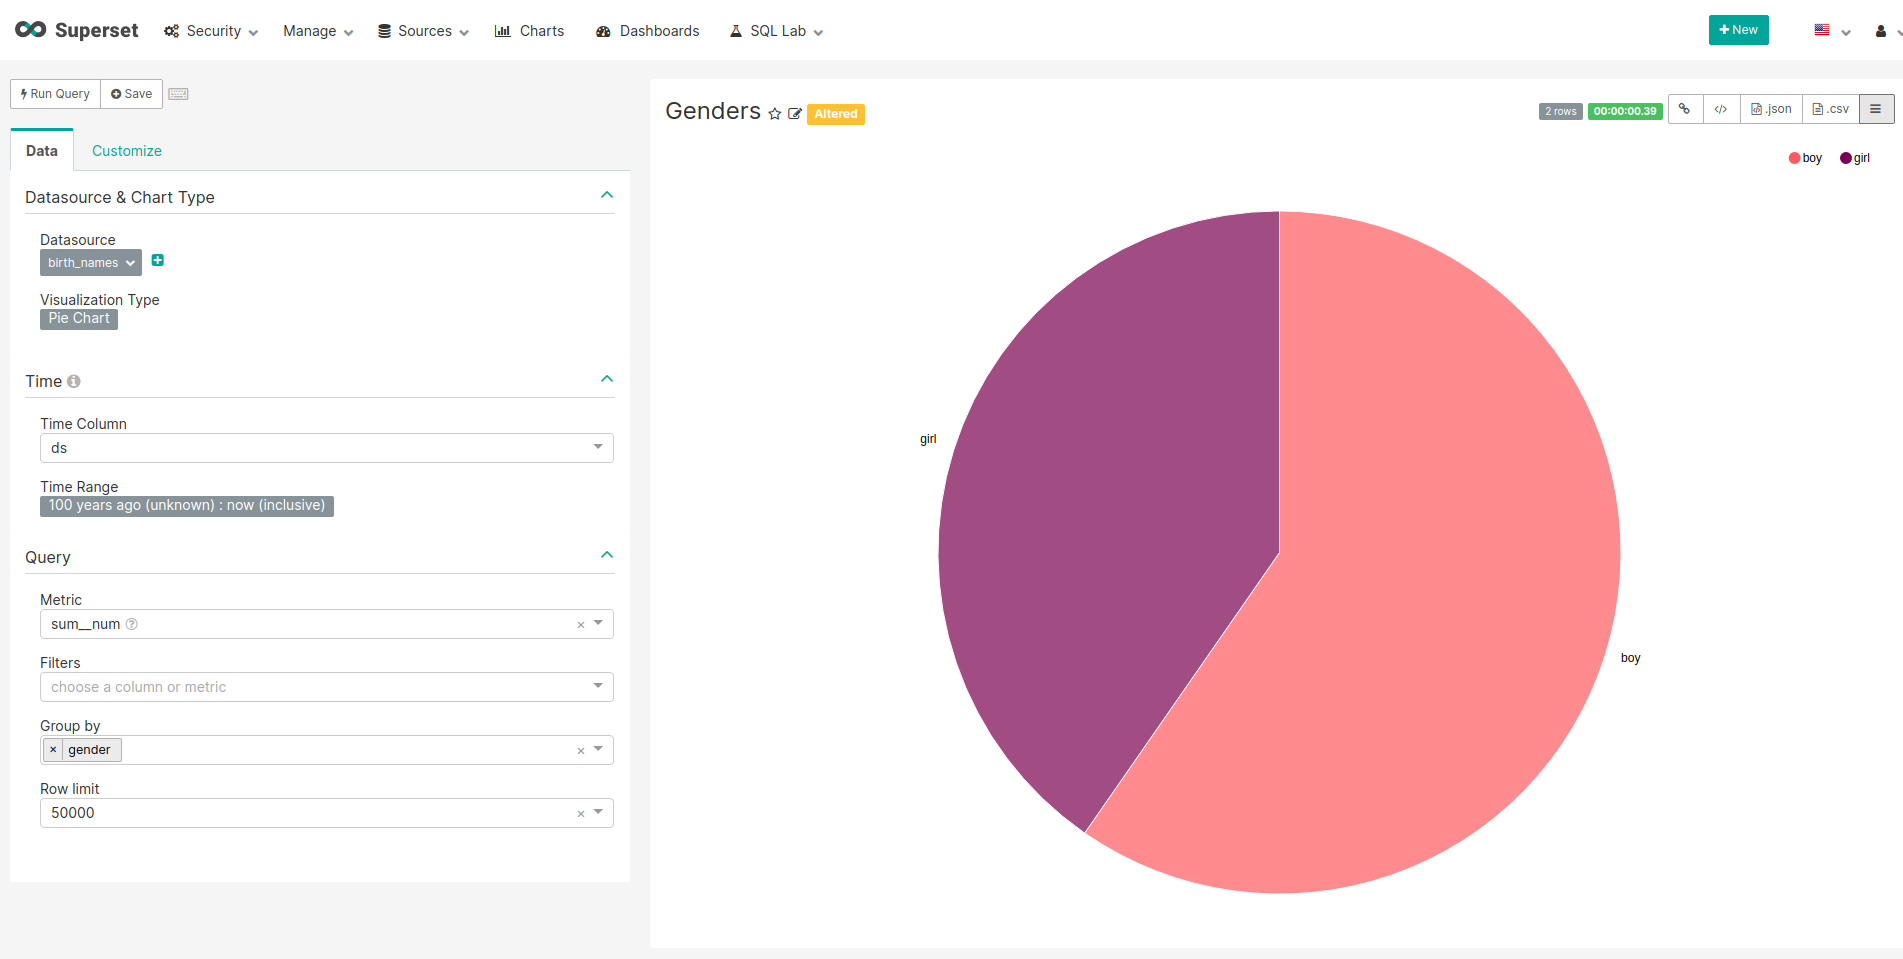
In Superset, the basic component is a chart (you can find examples of charts in the "Charts" tab). And the dashboards are made from the separate charts. All you need to create graph is SQL knowledge.
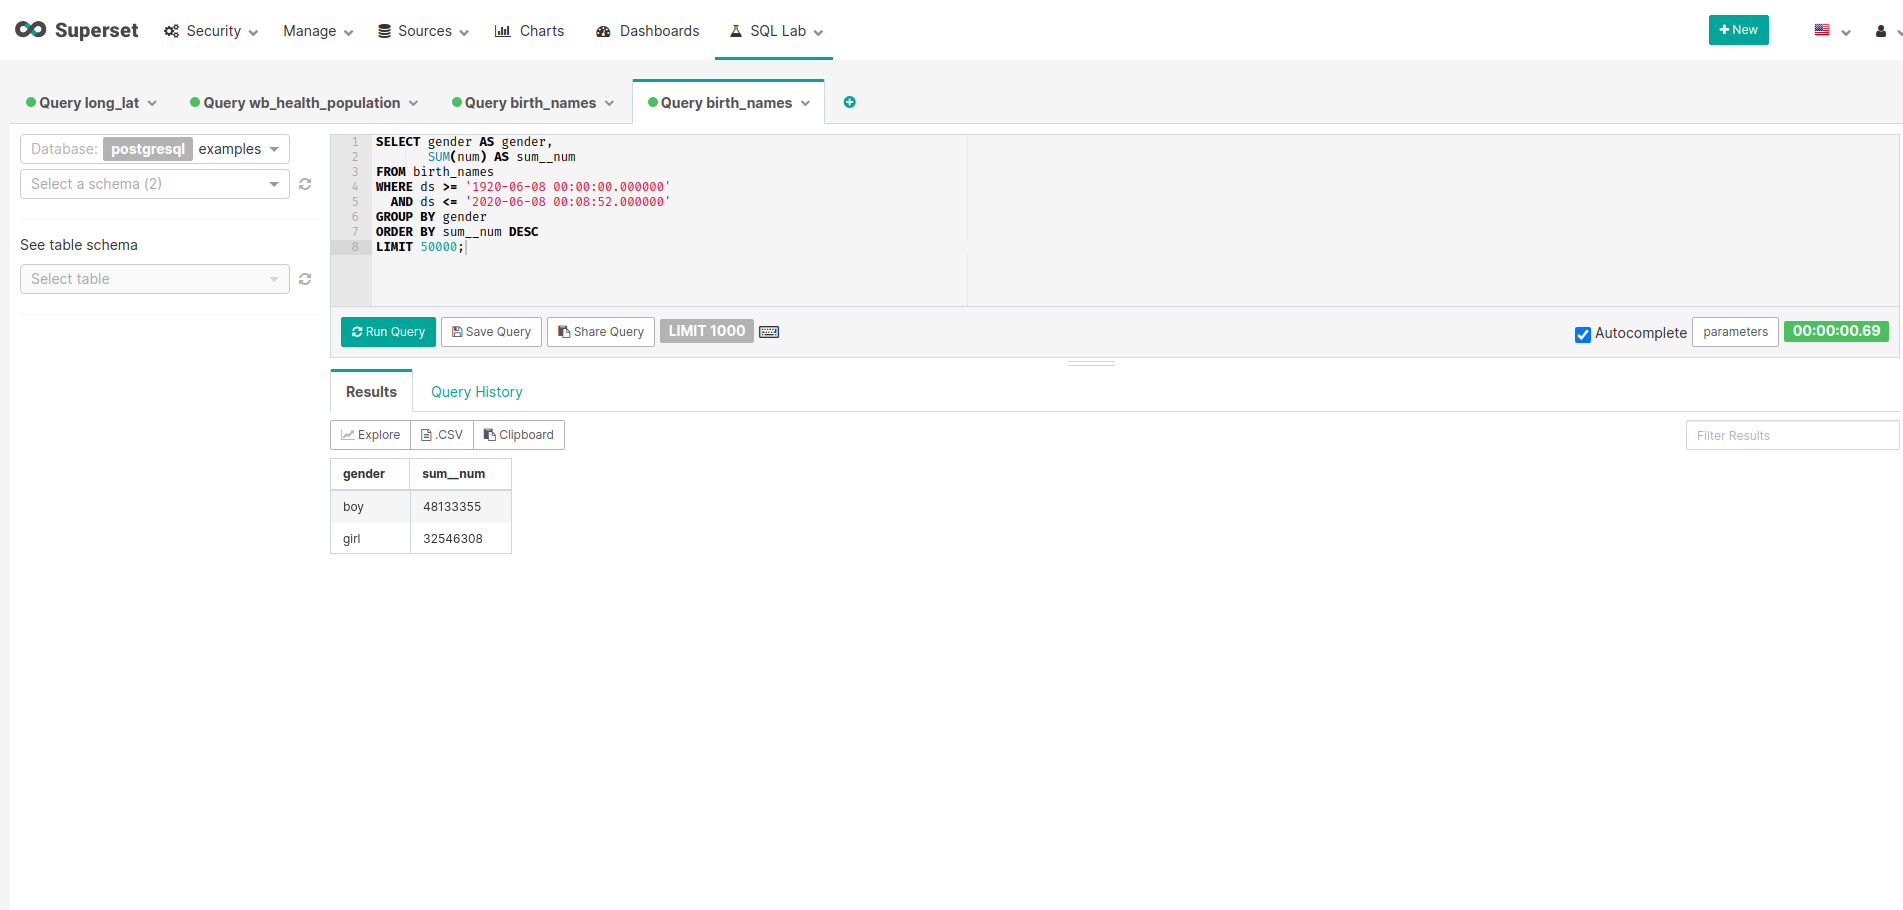
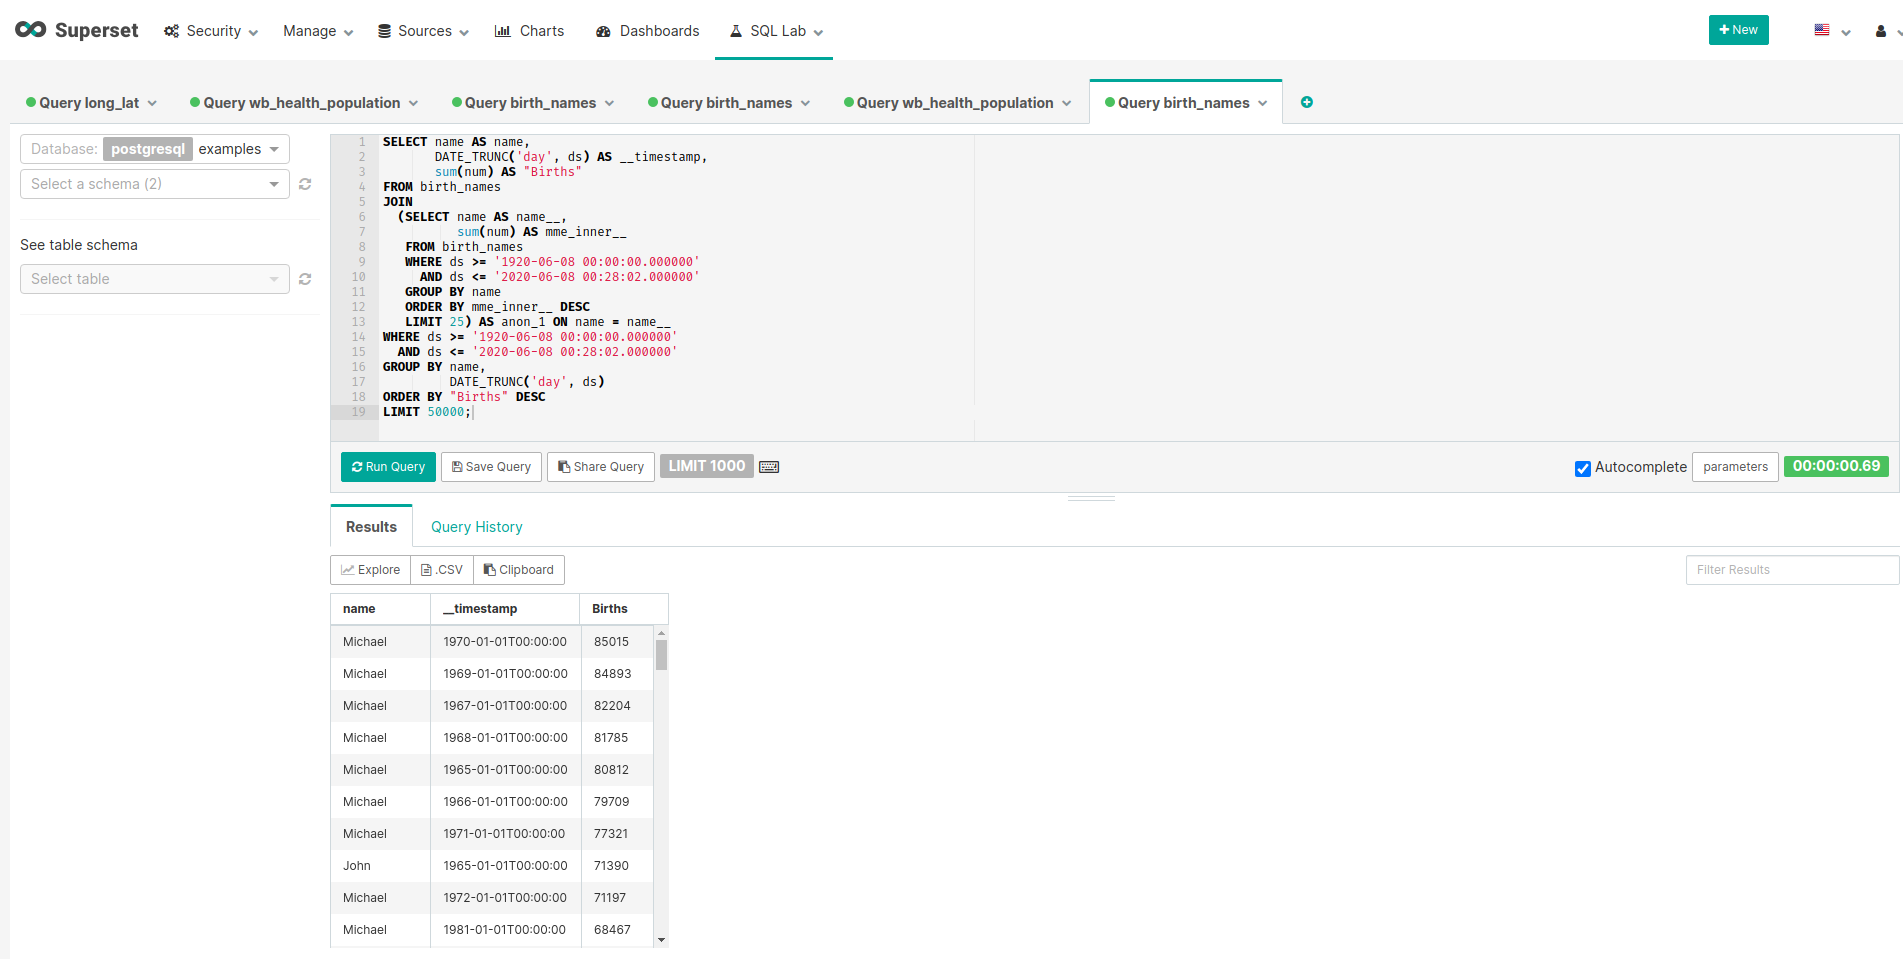
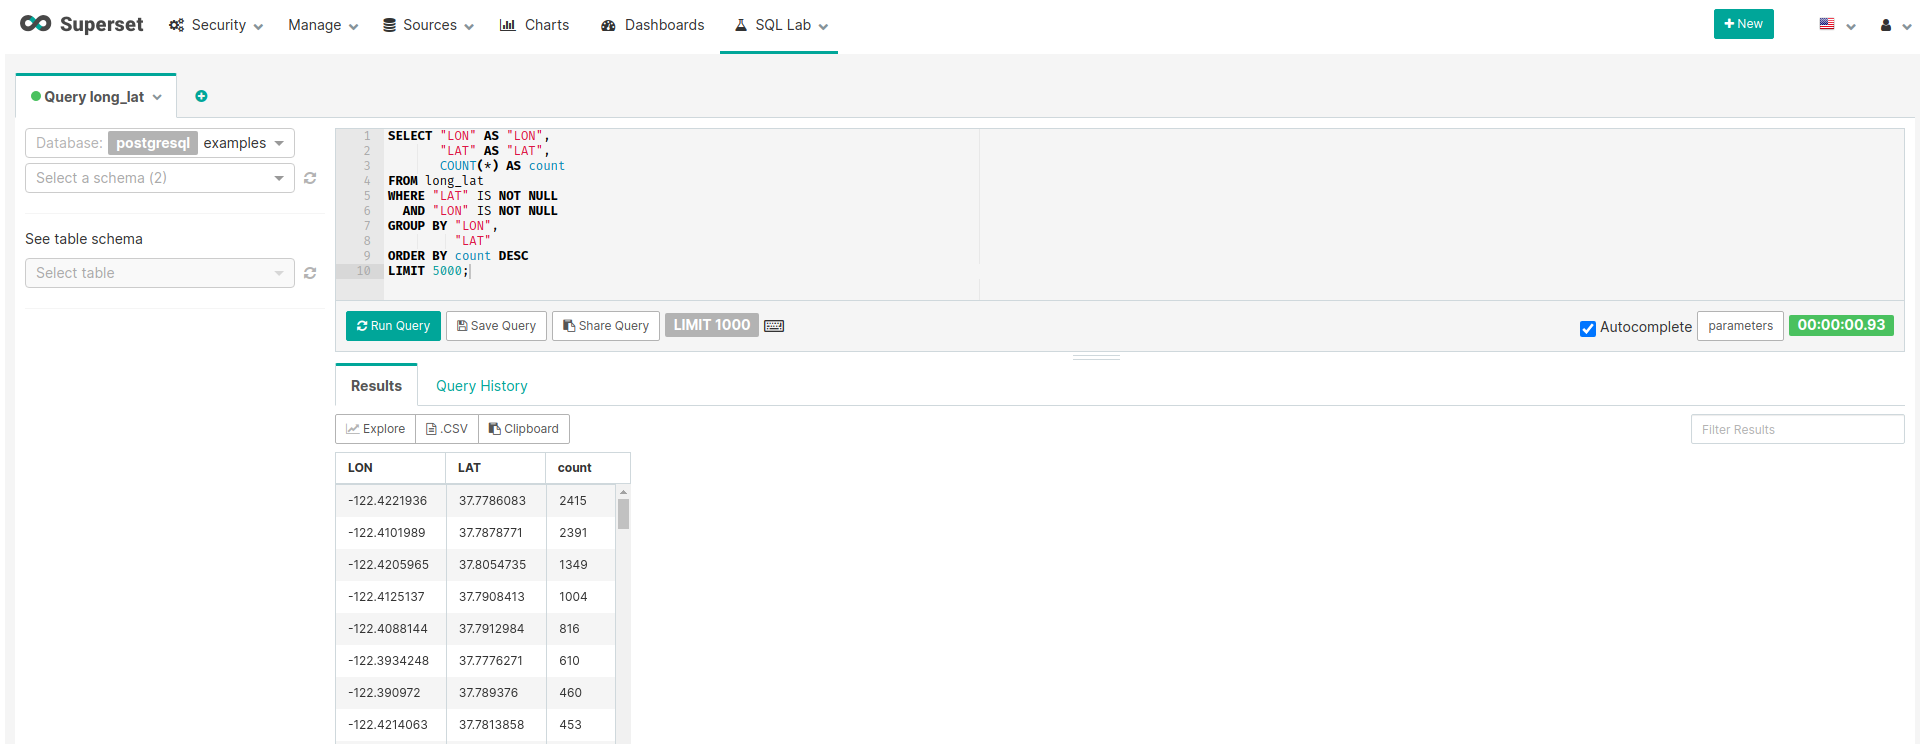
For your convenience, you can test your SQL query in the SQL lab tab and only then create graphs for them.

Below I will give comments on several charts that come bundled with Superset. Each chart will be accompanied by a corresponding SQL query. The data on which I build queries comes bundled with Superset.
Pie chart
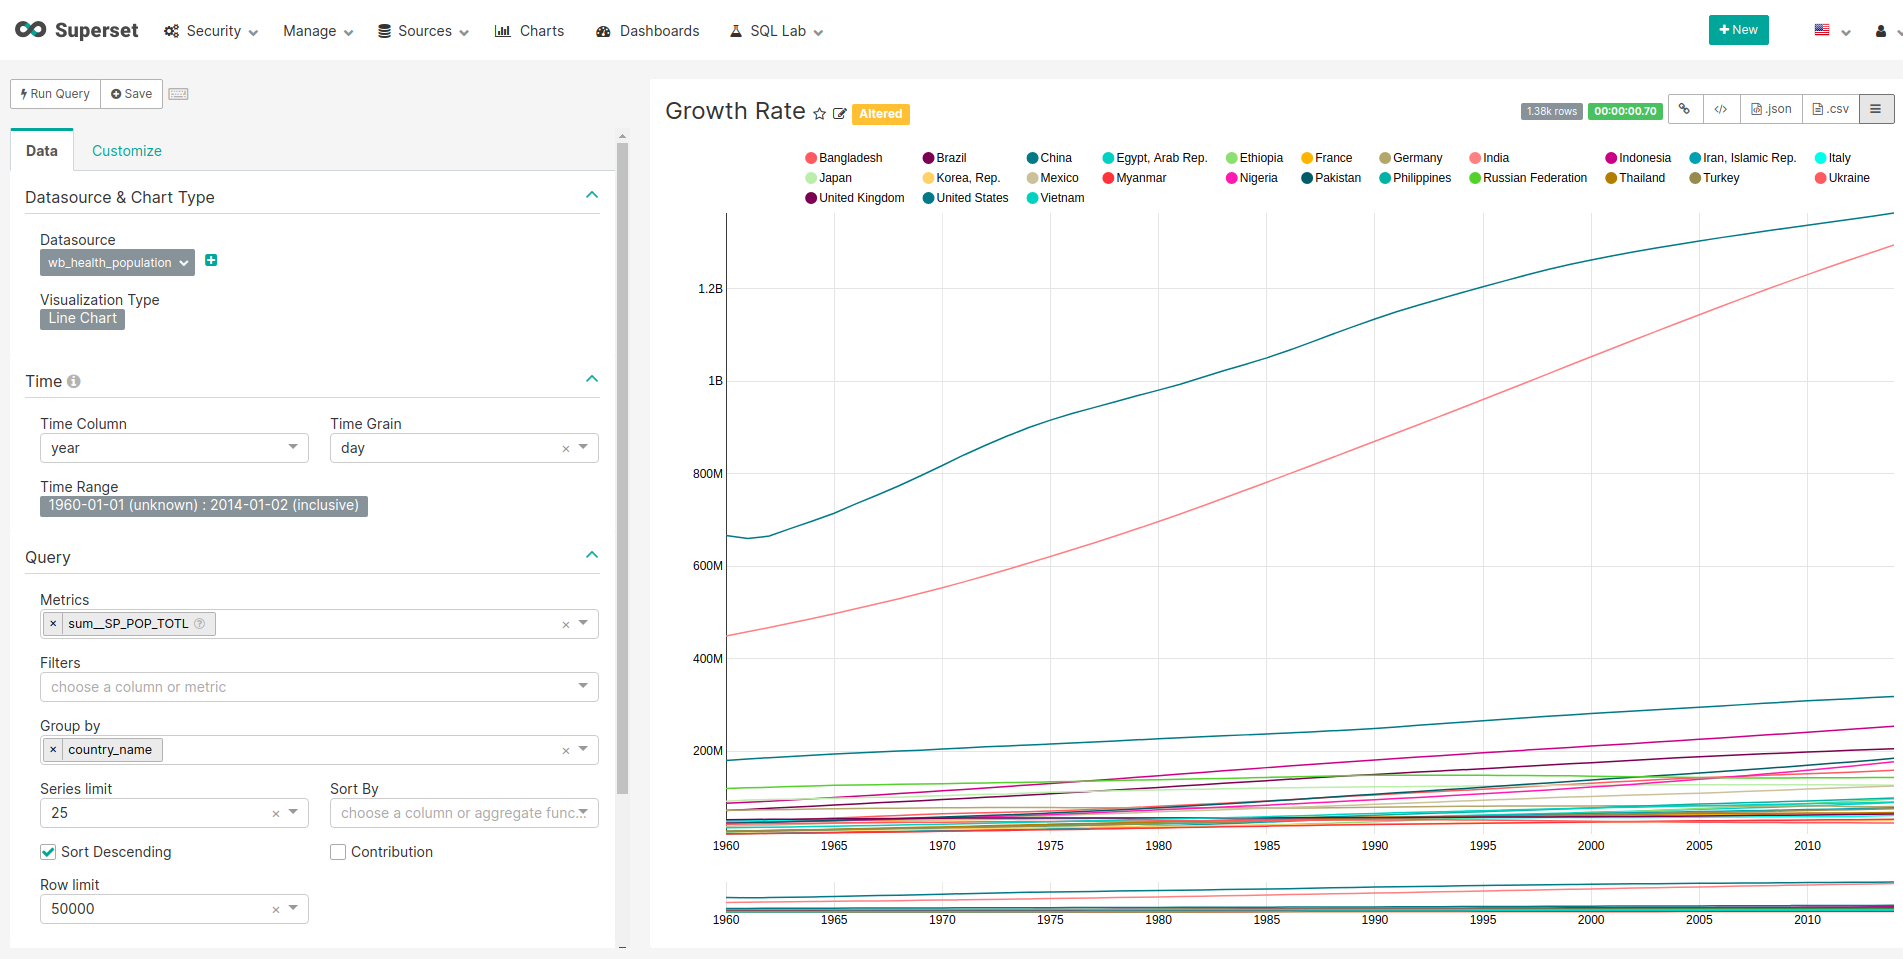
Line chart
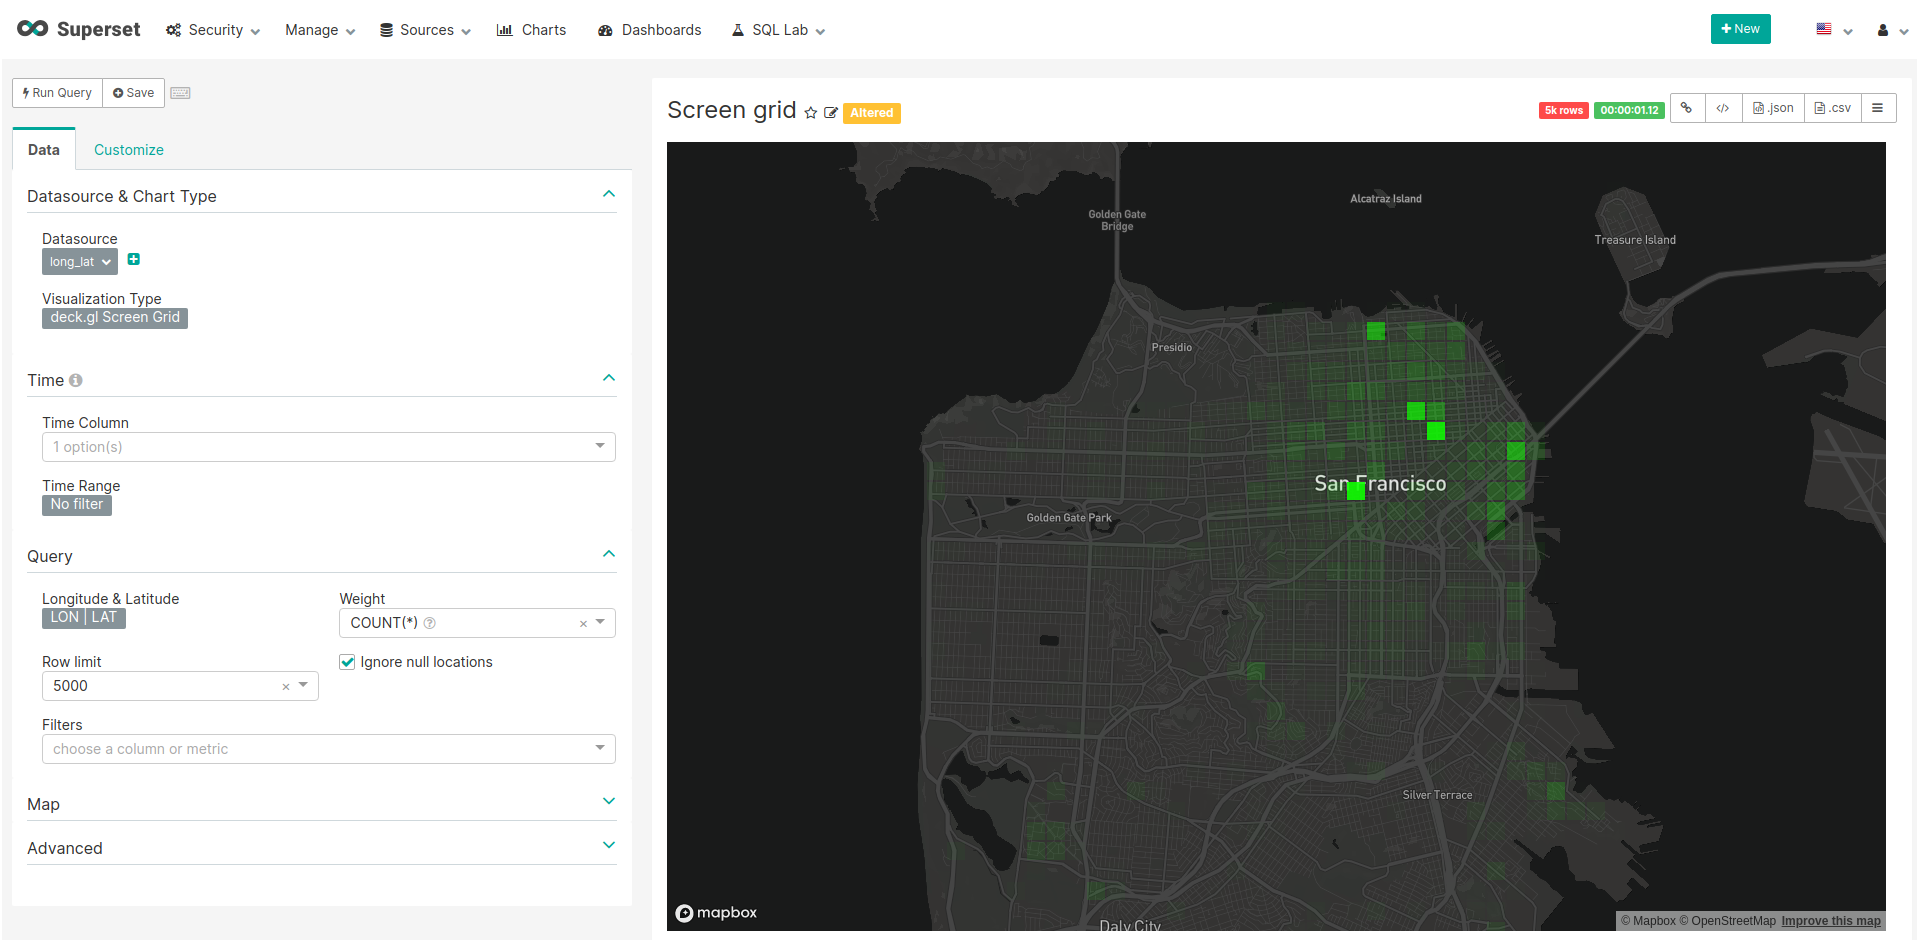
Geo data
Summary
Apache Superset is definitely a great candidate for your next BI system. If your data is stored in a supported format and you can’t wait to learn something new from it - you should try this platform. The cost of the initial installation and its support is practically zero, and the value from the received insights can be huge.