Visualizing data from your Node JS app with Prometheus + Grafana
In this article I'm going to show you how to build amazing dashboards for any Node JS application, tell you about using Prometheus with Grafana and give you some code templates, so you can use them to solve your own issues.
Main part of the article is not oriented to the Node JS developers, so it may be useful regardless the programming language.
Link to the Github repository with all the code:
https://github.com/pavlovdog/grafana-prometheus-node-js-example
I think most of us are constantly faced with data analysis tasks. Maybe will agree - having a picture in front of your eyes is much more convenient than putting your hands into the database or producing one-time scripts.
This approach becomes especially useful at the moment when the system "gets on the rails" - the number of users imperceptibly jumps over dozens, and then hundreds. And now you just do not have time to carefully monitor the application in manual mode. Also it’s just nice to feel yourself like Tom Cruise from the Special Opinion.
I'm gonna show you how to add awesome dashboards for any kind of metrics and give a simple example for Node JS application. Basically, this this approach works for any programming language, so you can use it with Python, Go, Rust, Scala, ....
Architecture
For visualization of metrics, I prefer to use the popular Prometheus + Grafana bundle. In the application, I integrate the data exporter for Prometheus, an example of which I will give below. Quick reference for those who are not familiar with this stack:
Prometheus

The simplest description is a time series database. The essence of the service is to collect data from the specified sources every X seconds and to save it in the timestamp -> data format. In our example, Prometheus will use only one data source - Node JS application. Communication is carried out using HTTP requests, the data is transmitted in a Prometheus-specific format, which I will describe below.
Grafana

Open-source platform for visualization and analysis of various data. You can connect a variety of data sources - these can be familiar databases (MySQL, PostgreSQL), or something more specific (Prometheus).
List of supported data sources
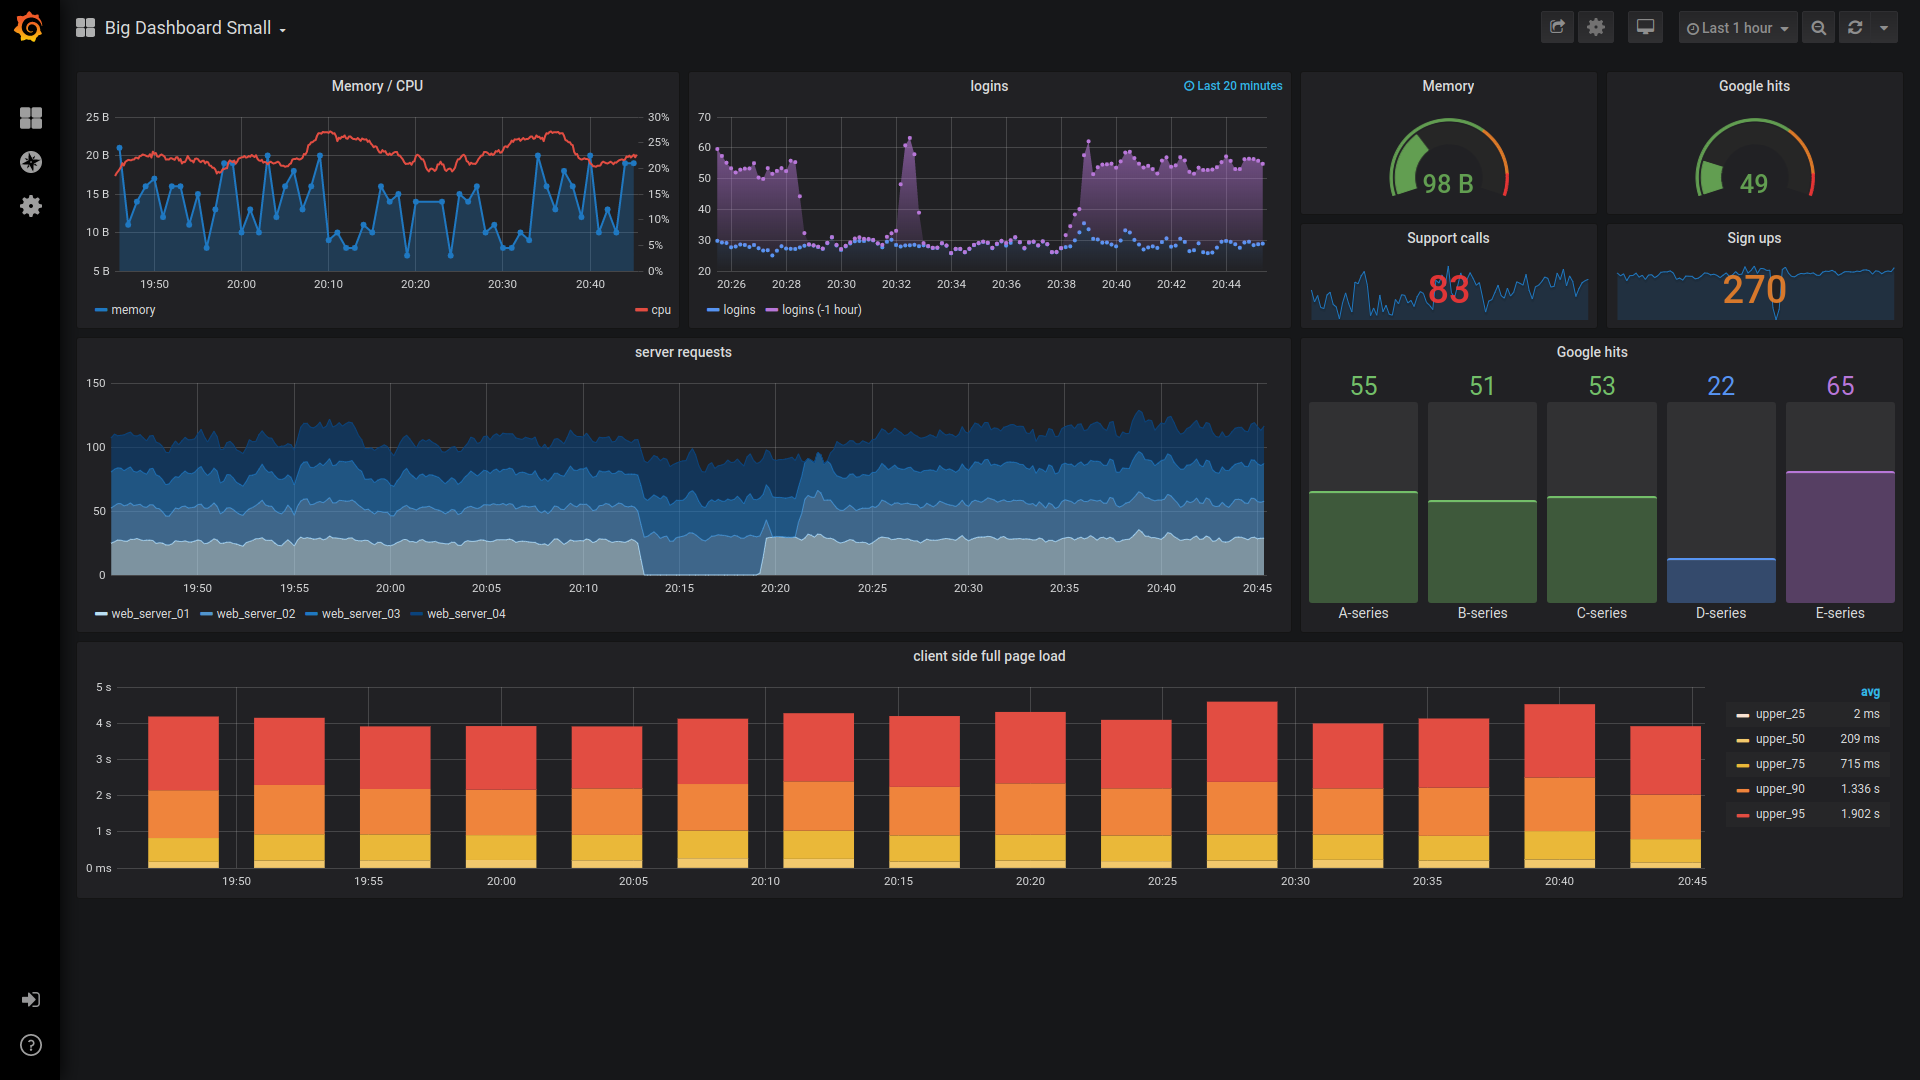
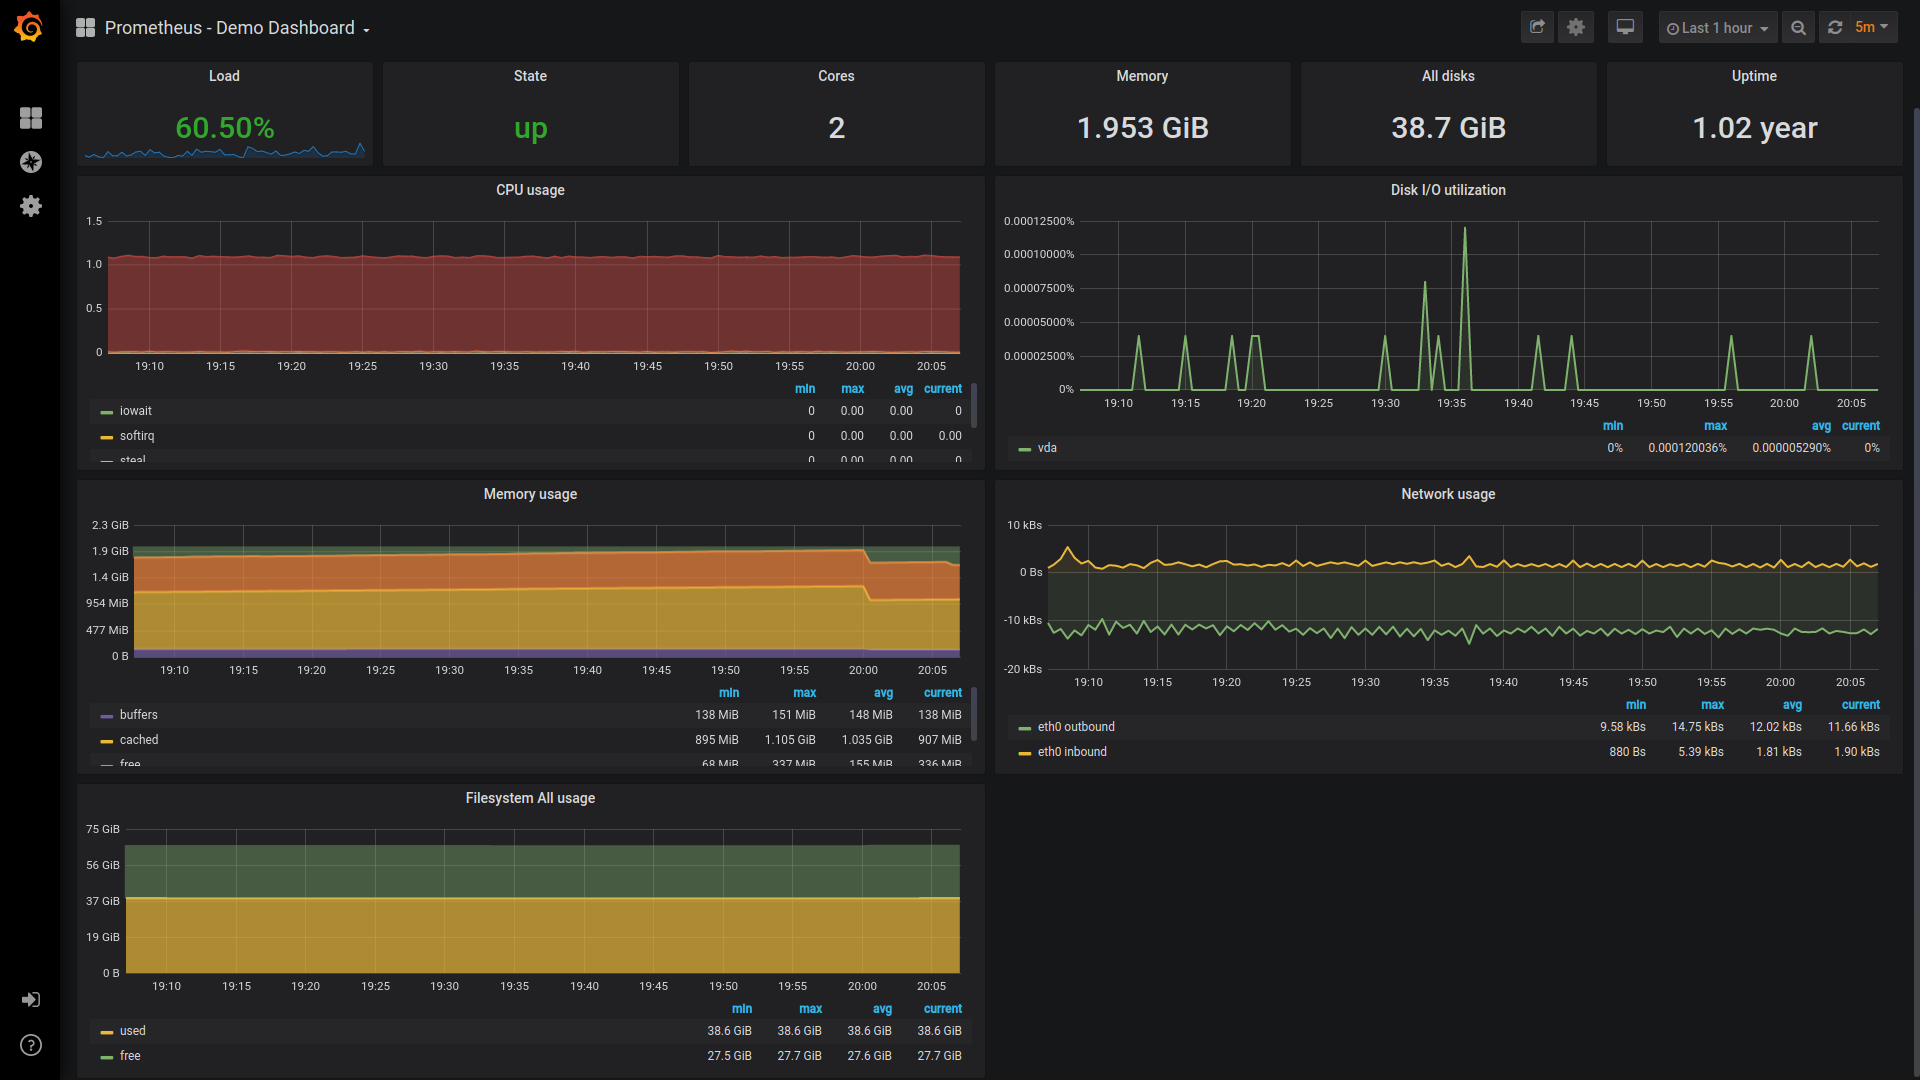
After the data sources are connected, you can begin to visualize the data you are interested in. For this, Grafana has various visualization tools - line chart, histogram, heatmap and many others. As a result, you get surprisingly informative and convenient visualizations:
Going deeper
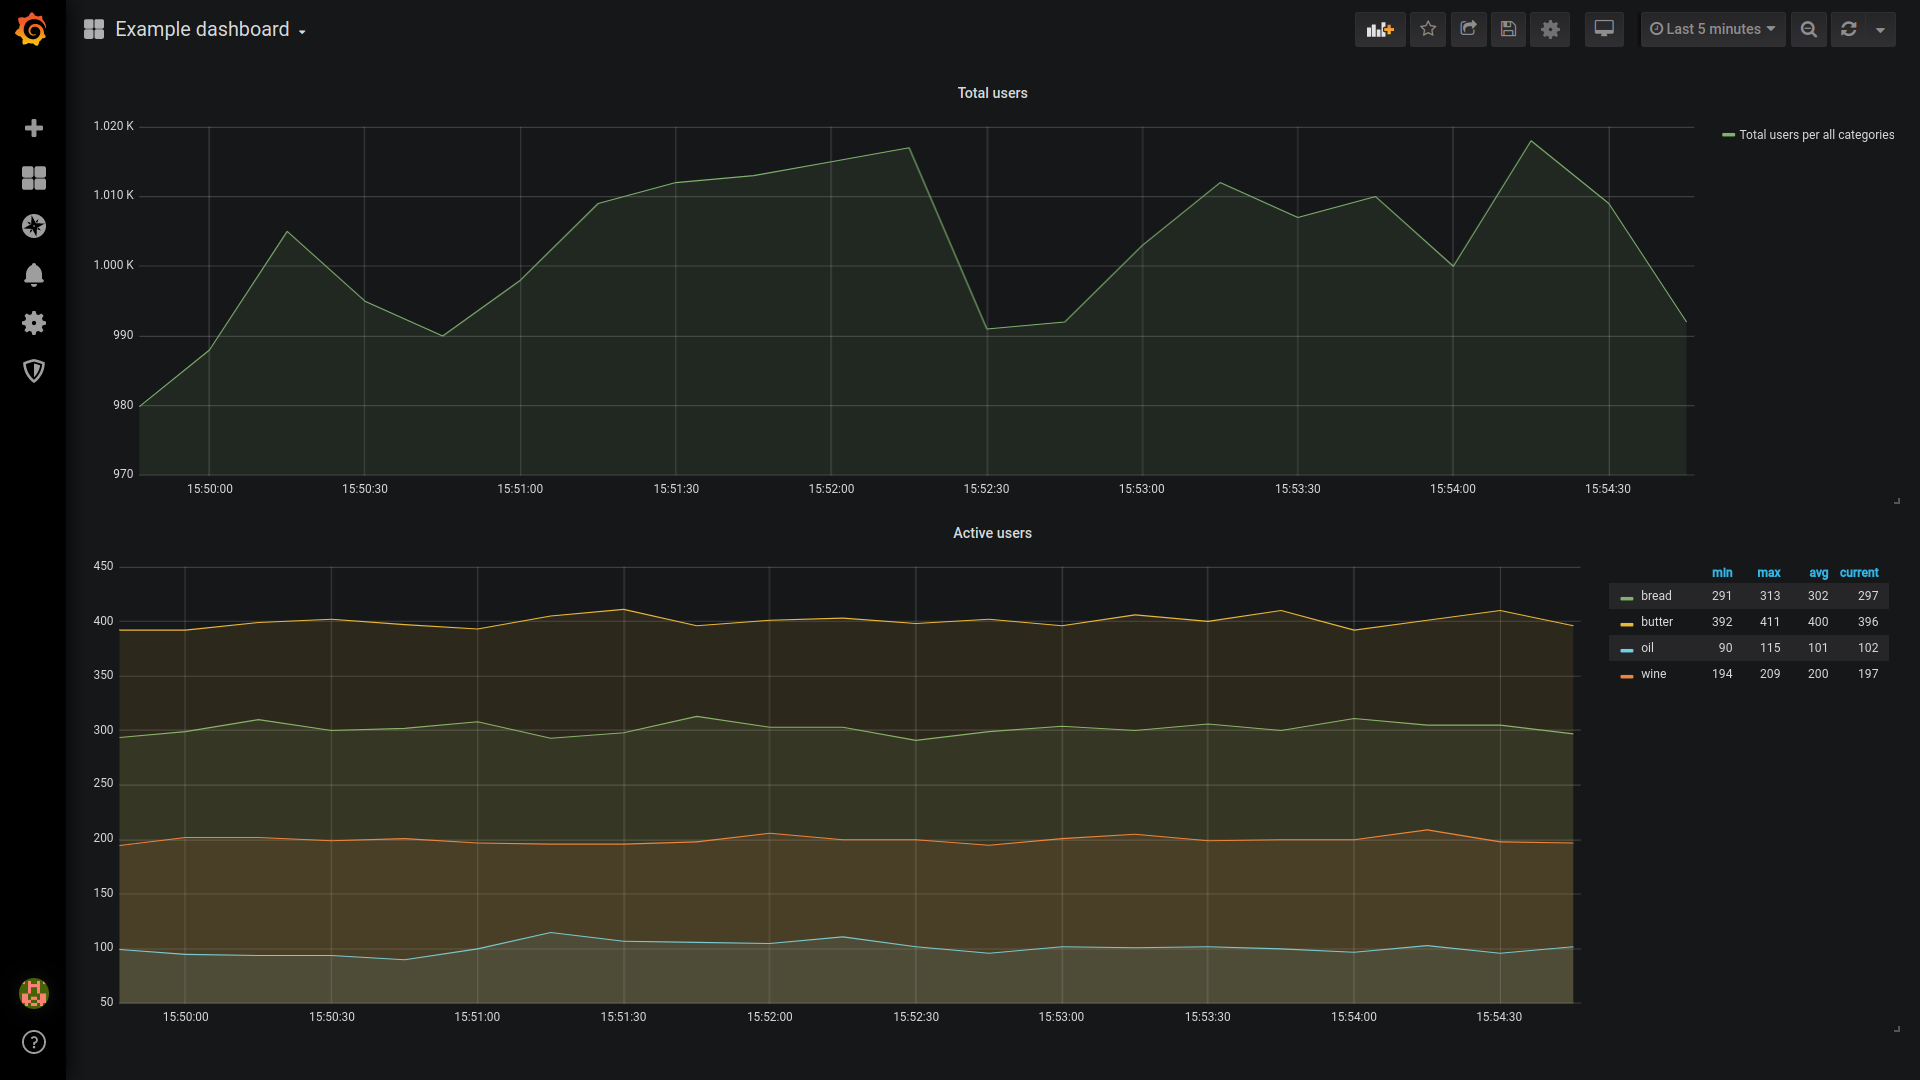
Let's imagine that we are dealing with an online store selling various food products. The store owner wants to have statistics in front of him. For example - "how many users are currently active in each category of goods - wine, oil, and so on?". Of course, we will not develop all the functionality, but use randomly generated data.
Below I will give an example of launching a Prometheus, Grafana and Node JS application, followed by an explanation of the technical details. You can find all the application code in the repository - https://github.com/pavlovdog/grafana-prometheus-node-js-example.
Launching the app
Launch the app with the following commands:
$ git clone https://github.com/pavlovdog/grafana-prometheus-node-js-example
$ cd grafana-prometheus-node-js-example/
$ docker-compose up -d
Just in case, here are the versions of docker and docker-compose:
$ docker --version
Docker version 19.03.5, build 633a0ea838
$ docker-compose --version
docker-compose version 1.23.1, build b02f1306
Result
After running the docker-compose, you can see the visualization of data at localhost:3000 (login - admin, password - illchangeitanyway):
Technical details
First of all, let's examine the structure of the application. It consists of three main components:
- Prometheus
- Node JS app
- Grafana
In addition, docker-compose is used to run all components. I will not describe the contents of all the files in the repository - instead, I will focus on the key components.
Prometheus
Let's look at the prometheus/prometheus.yml:
scrape_configs:
  - job_name: 'prometheus'
    scrape_interval: 5s

    static_configs:
      - targets: [
        'app:9200',
      ]
        labels:
          service: 'app-exporter'
          group: 'testing'
          name: 'app-exporter'
As I said above, Prometheus is scraping data for the specified resources, which are called targets. In our case, only one target is used - the Node JS application running on port 9200. The frequency of data collection is once every 5 seconds.
After launching Prometheus, you can examine the list of targets and their status using the built-in web interface at localhost:9090/targets.
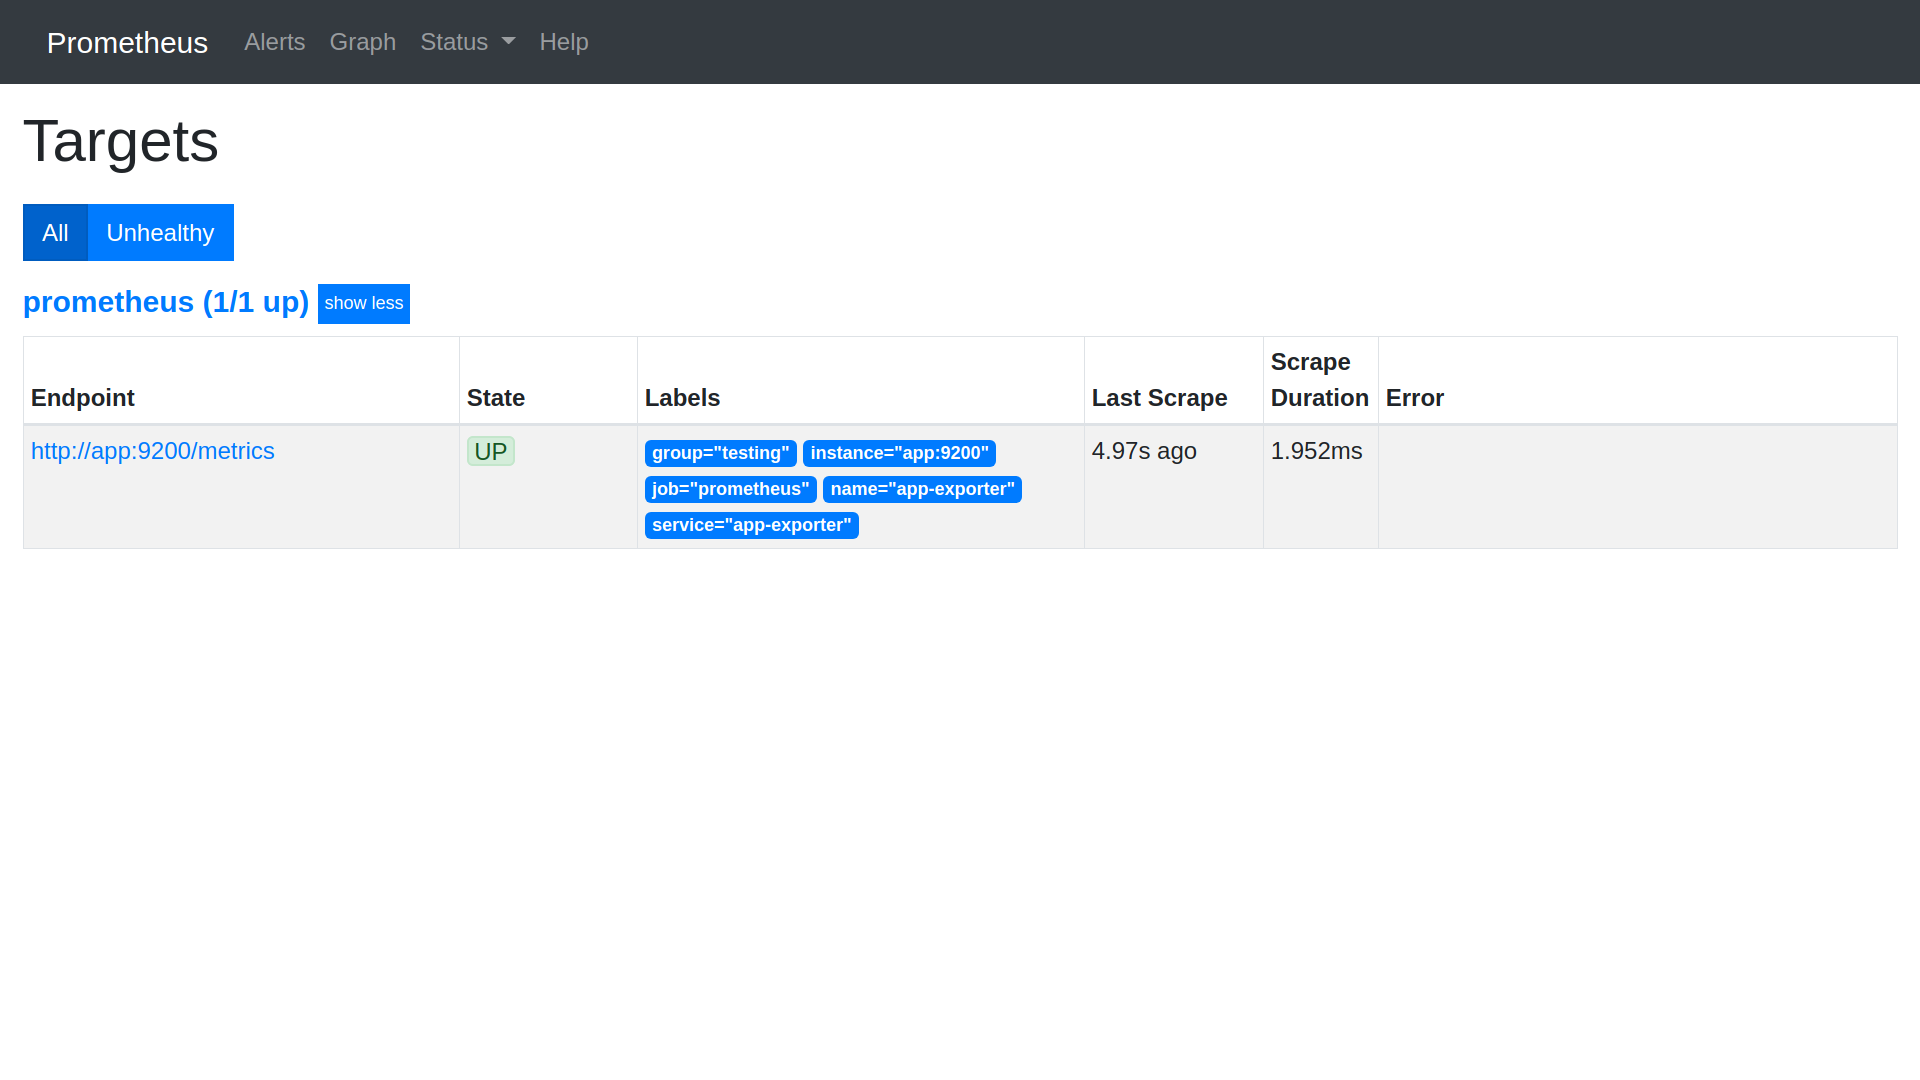
As you can see, Prometheus was able to successfully collect data from our application. Last time it happened 4.9 seconds ago.
App
As I said above, in the application we simulate data that owners of e-commerce stores may have - how many active users are on each category of goods. You can also familiarize yourself with the data format obtained by Prometheus. To do this, go to localhost:9200/metrics:
# HELP active_users Amount of active users right now per category
# TYPE active_users gauge
active_users{category="oil"} 100
active_users{category="wine"} 194
active_users{category="bread"} 289
active_users{category="butter"} 397
A small note - in the Prometheus configuration, we specified:
- targets: [
	'app:9200',
]
You might think that Prometheus will receive data by requesting the app:9200/. This is not so - by default it searches for data at the /metrics path (app:9200/metrics).
Grafana
Configuring Grafana for automatic deployment is a bit more difficult. Let's examine the contents of the ./grafana directory:
$ tree grafana/
grafana/
├── config.ini
├── dashboards
│   └── simple.json
└── provisioning
    ├── dashboards
    │   └── all.yml
    └── datasources
        └── all.yml
The key settings in this case are in the file grafana/provisioning/datasources/all.yml:
$ cat grafana/provisioning/datasources/all.yml
datasources:
- name: 'prometheus-monitoring-1'
  type: 'prometheus'
  access: 'proxy'
  org_id: 1
  url: 'http://prometheus:9090'
  is_default: true
  version: 1
  editable: true
In this file we specify the details for connecting to our data source - the Prometheus instance deployed on port 9090.
Querying the data source
Let me explain how Grafana requests data from Prometheus. When you add a new visualization (panel) to the dashboard, you specify the data source and the query. In the simple case, you can use MySQL and familiar SQL queries:
select category, active_users from my_table;In our case, Prometheus is used as a data source. Therefore, requests are written in its own language - PromQL. This is a functional language, rich enough for various operators and functions. Here's the query for getting the number of active users by each category:
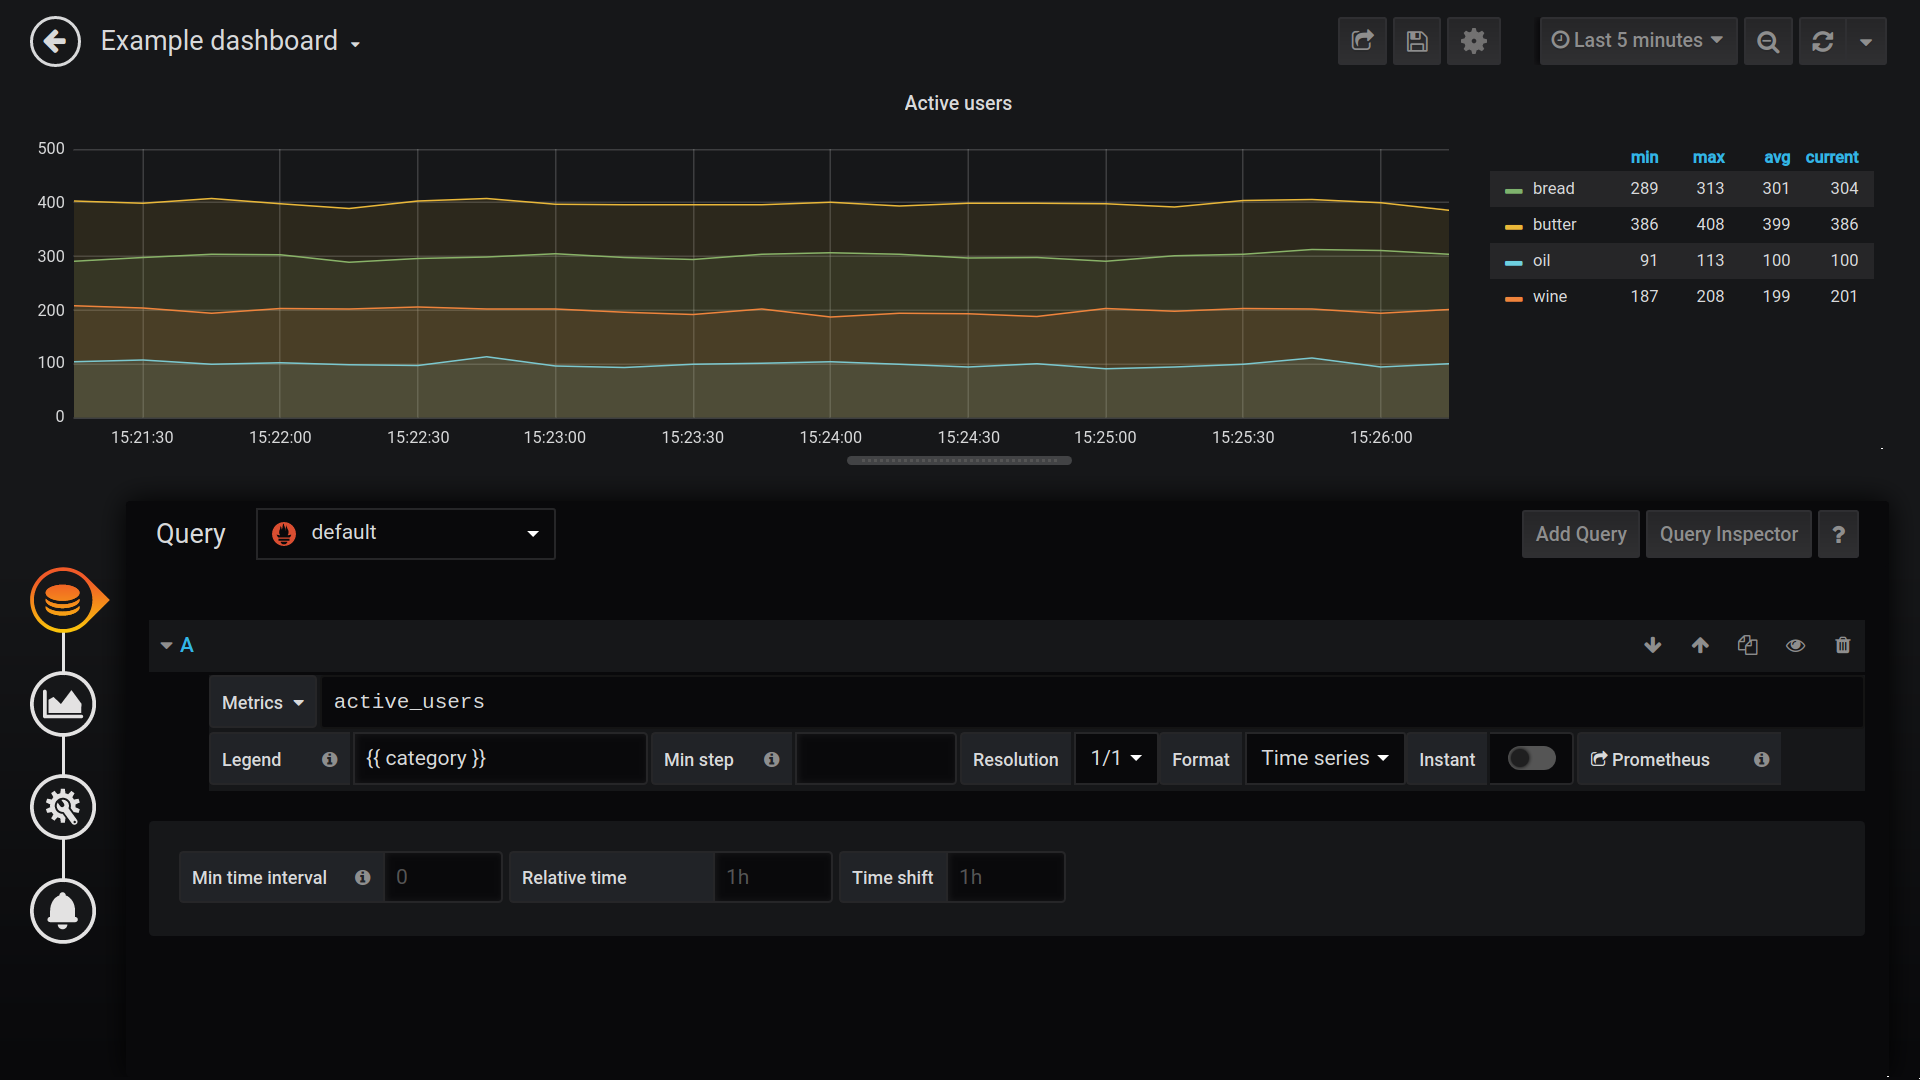
Grafana uses the handlebars syntax ({{...}}) for template purposes - we use it to create a neat label for the metric. The request itself is the receipt of data for all categories within the active_users metric:
active_usersYou can find another example of a PromQL query in the Total users panel (the total number of active users in all categories):
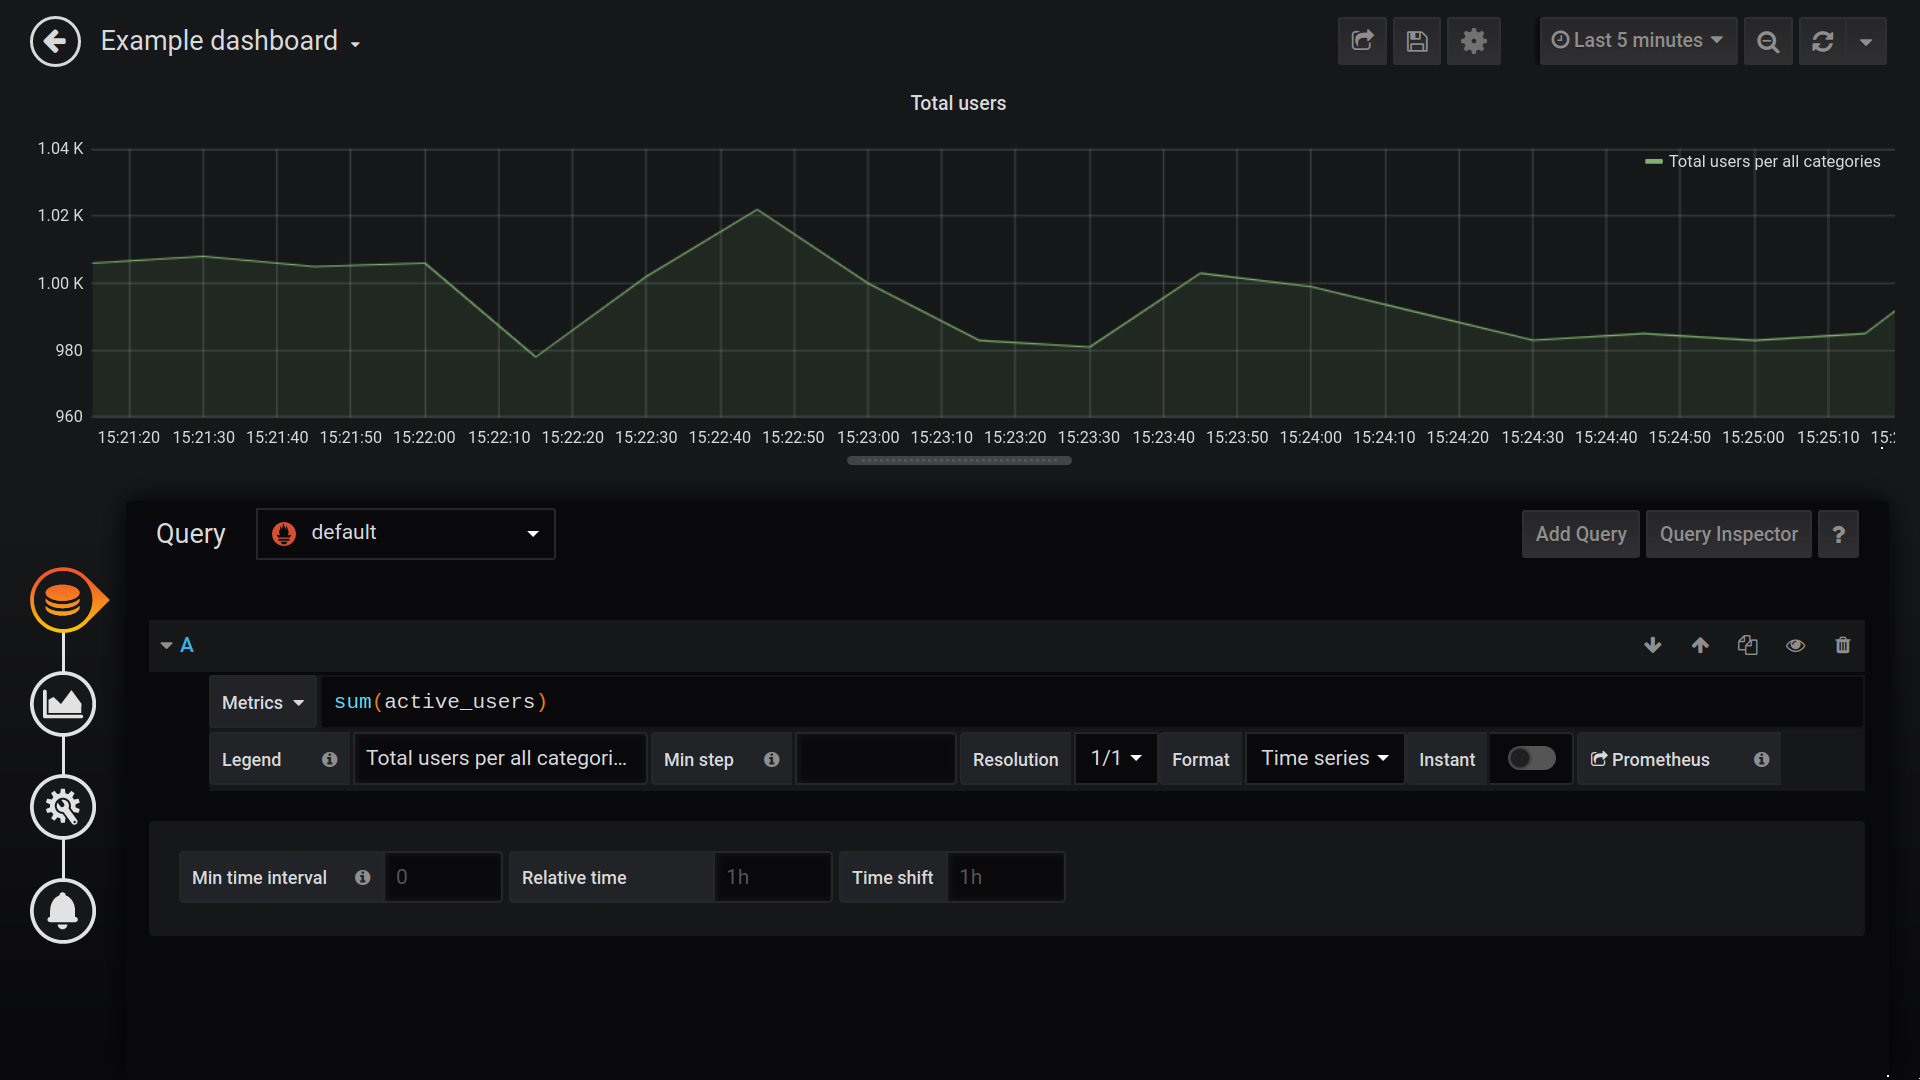
As you can see, we use the sum aggregation - it returns the sum of the values in the active_users metric.
sum(active_users)Conclusion
In this article I tried to describe one of the most interesting steps in the development of an IT service - the visualization of key application metrics. If you still have questions - do not hesitate to ask them in the Telegram chat. If you are interested in developing monitoring systems for your business, please contact me at sergey.p.moscow@gmail.com.
Join my Twitter, Facebook or Telegram channel to get notified about new posts.
See ya! 👨💻🐕
